
Energy & AI: Twin Engines Turbo-Charging Economic Growth
An event in Abu Dhabi on November 2, 2025, exploring the synergy between energy and artificial intelligence to boost economic growth.
ENERGY & AI: TWIN ENGINES TURBO-CHARGING ECONOMIC GROWTH 2 NOVEMBER 2025, ABU DHABI
2
3
4
5 Table of Contents 4 6 8 12 20 30 32 39 The ENACT Journey Executive Summary Current Market Reality Emerging challenges and trends shaping tomorrow’s energy landscape Meeting the Pace of Growing Demand in Uncertain Times Keeping up the next wave of AI and consumer enabled growth Build the Generation and Infrastructure at Scale and Pace Planning the next wave for greater integrated benefit Turbo-charging the Global Economy Realizing the next great leap in human progress Funding the Growth Efficient and effective distribution of capital to unlock global growth Proposed Solutions Turbo-charge the global economy through well-funded Energy and AI
6 Since the first ENACT Majlis held in Abu Dhabi in November 2024, much has happened and many of the actions identified have seen material progress. In that short space of time, 12GW of additional data center capacity has been added in the US, putting the energy system under strain, while AI has helped to accelerate technical and scientific progress and improve corporate productivity. Last year, energy, AI, investment and climate leaders defined a broad five-point action agenda, to help realize the transformative potential of AI and drive adoption across diverse energy systems: • Drive AI Integration: Develop a common framework to integrate surging AI demand in the energy system, including the development of a global integrated energy model (GIEM). • Deploy AI to Transform Energy: Use AI to plan and deploy infrastructure faster and decarbonize energy production, delivery and consumption • Empower the Emerging Economies: Address the technology and energy access gap through AI and energy partnerships • Mobilize Financing: Create financing models that incorporate the AI and energy value chain as a whole • Embrace AI Adoption and Build Talent: Develop concrete plans to create the necessary culture for AI and energy to work together and tackle the energy sector’s talent gap In June, we met up for the second ENACT in Washington and focused on opportunities and challenges in the US, developing a cross-sector framework for AI’s energy challenge to the solve for the short-term surge (2030) and address long-term uncertainties (2050) across energy, infrastructure, investment and policy. In this report we explore the progress made since the first ENACT, the changes that have happened in the market, the lessons learnt, and the next steps needed to turbo-charge the global economy with the twin engines of energy and AI, through: • Meeting energy demand growth needed to support the next wave of AI growth • Build generation and infrastructure at scale and pace while maximizing the integrated economic value • Fund the growth efficiently through the effective distribution of capital The ENACT Journey Responding to the short-term surge Delivering a smarter build-out for the long-term • Maximize the output of existing power generation capacity • Raise the load and reliability of transmission infrastructure • Enable demand management from all users • Deliver affordable energy for all • Optimally site the next wave of infrastructure • Build and fund a 21st century grid • Create a smart energy economy • Accelerate next- generation energy technologies
7 And underpinning it all: People, Policy & Permitting: we need skilled workforces and cultures that embrace AI; and smarter, faster, more predictable regulatory frameworks, where permitting becomes a catalyst, not a constraint. Meet energy demand growth ensuring investment in secure, accessible, sustainable supplies Fund the growth, by effectively and efficiently distributing capital Build infrastructure at scale and pace, through integrated approaches • Momentum has accelerated on meeting AI-driven surge with operators pulling all levers to repurpose power to supply near-term data center demand • US added 12 GW of data center capacity and approved 55mtpa of new LNG projects • China mandated 80% of data center electricity come from renewables by 2030, and in the UAE, Masdar is advancing a project to deliver 1 GW of 24/7 solar • Consumer energy costs have risen while industry has continued to deliver efficiencies reducing the unit cost of production • AI has helped to raise corporate profits in the face of lower energy prices and drive 40% of US GDP growth in Q3 • Al has helped to raise corporate profits in the face of lower energy prices and drive 40% of US GDP growth in Q3 • Tech-energy partnerships are developing, like Google- Kairos Power, Amazon-Iberdrola, Nvidia-Reliance and Microsoft-Three Mile Island, providing greater insights and learnings • Public-private investment rising, but significant infrastructure constraints persist: Large joint public- private commitments are improving infrastructure funding, but transmission and interconnection bottlenecks continue • The UAE is leading by example, developing one of the world’s largest data center complexes in partnership with global AI leaders - a model for integrating technology, power, and investment at scale • Grid optimization tools deployed and battery solutions used to deconstrain grid • PPAs signed between DCOs and energy companies for SMRs, fusion and geothermal • Consensus is that building 1 GW of data center capacity requires $40–50 billion of capital, including power, chips, land, and cooling • Globally, about $4 trillion per year is needed to meet combined AI and energy investment needs (approx. $2.5 trillion in energy and $1.5 trillion for data centers and associated infrastructure) • Competition for capital is intensifying - energy projects must now rival AI infrastructure for investor attention • Concentration of the majority of new data center investment remains anchored in the US and mature markets with limited diversification into emerging regions SINCE THEN… SINCE THEN… SINCE THEN… • Agreed no single energy source can meet future needs - an “and, and” approach remains essential • Considered how to leverage AI to build a better integrated energy system, maximize existing generation, and optimize systems • Explored how we create value from AI, and specifically its role in energy optimization • Leaders agreed we need to leverage Al to build a better-integrated energy system and GIEM model, and leverage them to drive efficiencies in their businesses. • Identified co-location and siting strategy as critical, given it’s easier to move data than energy • Explored how policy and AI can accelerate every stage of infrastructure build-out • Learned the threat of higher electricity prices and lower reliability challenging social license • Industry recognized the need to better utilize existing assets and de-constrain the existing grid with the help of Al tools while accelerating advanced generation technologies • Heard capex ranging from 10-45bn for 1GW data centers • Highlighted the need for integrated financing models that link chip makers, hyperscalers, and energy producers • Explored how innovative financing such as catalytic equity and enterprise-backed credit can unlock capacity AT THE LAST TWO ENACTS WE… AT THE LAST TWO ENACTS WE… AT THE LAST TWO ENACTS WE… 7
8 1. The Energy Outlook Energy and AI are the twin engines that have the potential to turbo-charge socioeconomic growth, but energy-intensive data centers are competing for energy alongside multiple demand drivers in a growing and increasingly complex world. Gathering at the third ENACT Majlis, energy, technology, investment and government leaders met in Abu Dhabi to advance, together, the integrated solutions needed to ignite the twin engines of energy and AI to accelerate global growth. This Majlis emphasized a pragmatic, “less rhetoric, more results” approach, an “and-and” energy strategy across molecules and electrons, and urgency on permitting, supply-chain diversification and talent to keep pace with AI demand. Executive Summary Capital Flow Wealth Creation Policy (Governance) People (Talent) Energy Over the past 12 months, the US alone has added 12GW of data center capacity, which has added to the surge in electrification around the world and which, today, still relies on 57% molecules to produce that power. Participants acknowledged that today, we are less in an energy transition than in an energy addition, needing more gas, more renewables and more batteries as the only way to provide firm power to data centers. Massive uncertainty in energy demand depends on the pace of AI growth, development of the Global South, and the speed of the energy transformation, with power supplied from molecules expected to fall to 21% by 2050. Building on this, participants stressed that “power is knowledge”: without abundant, affordable electricity, AI’s promise stalls. Policy stability is as critical as geology, and capital will follow low-cost power. In addition, the industry is facing price pressures which could impact capital budgets. Lower oil prices may impact production, including in the US, where lower associated gas would impact availability and push up the price of gas for data centers, and would decelerate the progress in shifting to alternative energy sources such as EVs and SAF. Lower investment could lead to future price shocks. Participants also warned that public tolerance for higher electricity bills is shrinking, making affordability a political risk for AI build-outs unless new generation and grid upgrades are co-delivered with siting. For the first time in human history, a kilowatt of electricity can be turned directly into intelligence. But we cannot achieve the dream of AI without more power. Power is knowledge now. Unattributed quote dealing with uncertainty and price pressures
9 Energy companies are struggling to keep up with the current surge in demand and as such the world must focus on doing more with less energy. Electrification is key to a lower energy intensity world, where EVs and heat pumps are far more efficient than their predecessors but need a build out of new infrastructure to support them. 80% of today’s data centers are concentrated within the US, Europe and China, relying on 26.4% gas to generate the power they require, using location-based accounting. With rising gas prices this has resulted in higher consumer power prices, while shortages and delays in the gas turbine supply chain are creating a new choke point. Electrification Scale Data centers Concentrating Power Demand • Gas filling the gap • New technologies (nuclear fission) Electrification Incremental Energy Efficiency Dispersed, Incremental Power Demand Renewables As a new, energy-intense sector, data centers can be the solution for bringing new capital to energy markets and concentrated demand to enable investment in highly capital-intense projects such as gas turbines, nuclear fission, geothermal and even fusion. Data centers will need to be sited around regional archetypes based on access to abundant low-cost energy, talent, and resources able not just to consume but also drive build-out, integrated value such as water, cooling and heating (into residential, agriculture etc.) and availability of capital. Participants added three siting imperatives: co-locate compute with generation to bypass transmission bottlenecks; pair gas with renewables and batteries to deliver cleaner-firm profiles; and engage communities early on water and price impacts to sustain a social license to build. However, we must be clear that efficiency gains alone will not overcome grid constraints. Majlis participants highlighted immediate, scalable efficiency wins: governments enabling private performance contracts can yield 20–30% savings in electricity and water at system level, freeing capacity for AI loads before new plants are needed. We still rely on molecules to create the electrons that AI needs. This is not an energy transition, but an energy addition — more gas, more renewables, more storage to power data centers reliably. Unattributed quote 2. Doing More with Less 3. Data Center Siting to maximize integrated value for data centers and consumers in a more energy efficient world
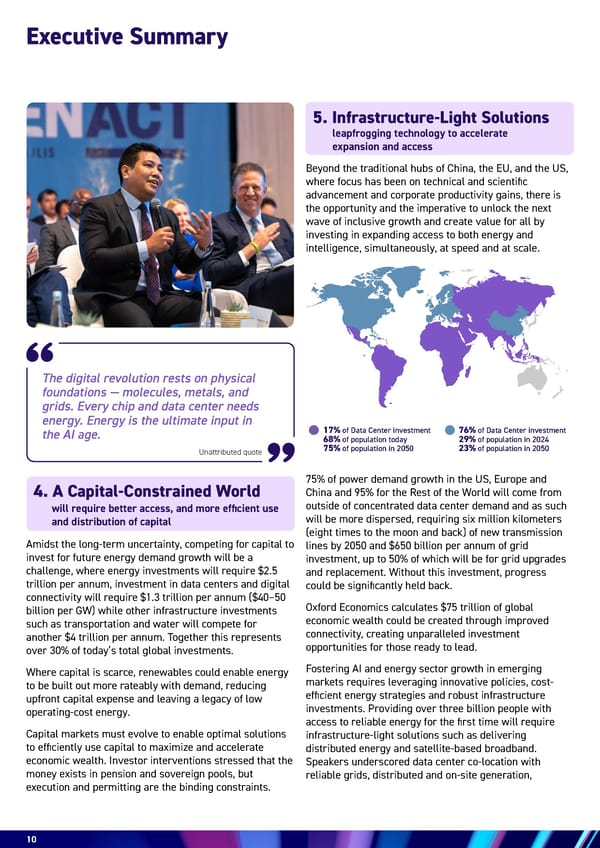
10 Executive Summary Beyond the traditional hubs of China, the EU, and the US, where focus has been on technical and scientific advancement and corporate productivity gains, there is the opportunity and the imperative to unlock the next wave of inclusive growth and create value for all by investing in expanding access to both energy and intelligence, simultaneously, at speed and at scale. 17% of Data Center investment 68% of population today 75% of population in 2050 76% of Data Center investment 29% of population in 2024 23% of population in 2050 75% of power demand growth in the US, Europe and China and 95% for the Rest of the World will come from outside of concentrated data center demand and as such will be more dispersed, requiring six million kilometers (eight times to the moon and back) of new transmission lines by 2050 and $650 billion per annum of grid investment, up to 50% of which will be for grid upgrades and replacement. Without this investment, progress could be significantly held back. Oxford Economics calculates $75 trillion of global economic wealth could be created through improved connectivity, creating unparalleled investment opportunities for those ready to lead. Fostering AI and energy sector growth in emerging markets requires leveraging innovative policies, cost- efficient energy strategies and robust infrastructure investments. Providing over three billion people with access to reliable energy for the first time will require infrastructure-light solutions such as delivering distributed energy and satellite-based broadband. Speakers underscored data center co-location with reliable grids, distributed and on-site generation, Amidst the long-term uncertainty, competing for capital to invest for future energy demand growth will be a challenge, where energy investments will require $2.5 trillion per annum, investment in data centers and digital connectivity will require $1.3 trillion per annum ($40–50 billion per GW) while other infrastructure investments such as transportation and water will compete for another $4 trillion per annum. Together this represents over 30% of today’s total global investments. Where capital is scarce, renewables could enable energy to be built out more rateably with demand, reducing upfront capital expense and leaving a legacy of low operating-cost energy. Capital markets must evolve to enable optimal solutions to efficiently use capital to maximize and accelerate economic wealth. Investor interventions stressed that the money exists in pension and sovereign pools, but execution and permitting are the binding constraints. The digital revolution rests on physical foundations — molecules, metals, and grids. Every chip and data center needs energy. Energy is the ultimate input in the AI age. Unattributed quote 5. Infrastructure-Light Solutions 4. A Capital-Constrained World leapfrogging technology to accelerate expansion and access will require better access, and more efficient use and distribution of capital
11 Key Solutions: Optimize the Energy System Launch coordinated energy mapping to balance supply and demand and reduce capital intensity. Use AI to optimize grid design, integrating centralized and distributed systems. Advance battery siting and optimization models and produce energy- infrastructure maturity assessments to guide investment and accelerate next-generation clean-tech deployment. Maximize the Value of Data Center Siting Define new siting archetypes beyond the US and China, aligned with energy availability and community benefits. Develop data partnerships to address data- sovereignty barriers and promote shared infrastructure standards for efficiency and carbon accounting. Embed community integration and demand-side management tools and establish regional tech-maturity and talent scores to attract investment. Different policy models are shaping how energy and AI integration progresses across major economies. The United States is leveraging private capital and market- driven innovation, while China is advancing through large-scale planning and renewable co-location mandates. Europe continues to refine a coordinated approach focused on decarbonisation, digitalisation, and competitiveness. Despite these differences, one priority is universal - the need for smarter, faster permitting, and clear regulatory frameworks to unlock investment at scale. Smart policies that support investment and AI regulatory ecosystems are essential to enable progress, not obstruct growth, and to build AI-enabled workforces capable of grasping the economic opportunity ahead. As several participants observed, energy policy is now industrial policy: it must remain pragmatic and guided by insight, because regulation without realism risks slowing growth, weakening competitiveness, and choking capital. Improve Access and Use of Capital Redesign financial models to align with system-wide efficiency, not individual assets - minimizing the levelized cost of energy (LCOE) across networks. Scale catalytic equity, enterprise-backed credit, and low- cost, infrastructure-light solutions that widen access to energy intelligence. Expand digital finance inclusion through online banking and simplified credit access to drive participation and productivity. Ultimately the cost of Intelligence will converge with the cost of energy. The Majlis consensus: energy abundance is the precondition for AI abundance; align policy, capital and talent now to deliver both at scale and pace, seizing this next economic wave of growth brought by the Intelligence Age. and satellite broadband as practical leapfrogs, while warning that grid reconductoring and interconnects are essential to avoid curtailment and stranded renewables. We need massive investment and the capital is there but the barrier is policy and permitting. Fix that, and the capital will flow. Unattributed quote 6. Policy and Talent are key to developing an ecosystem attractive to investment and growth
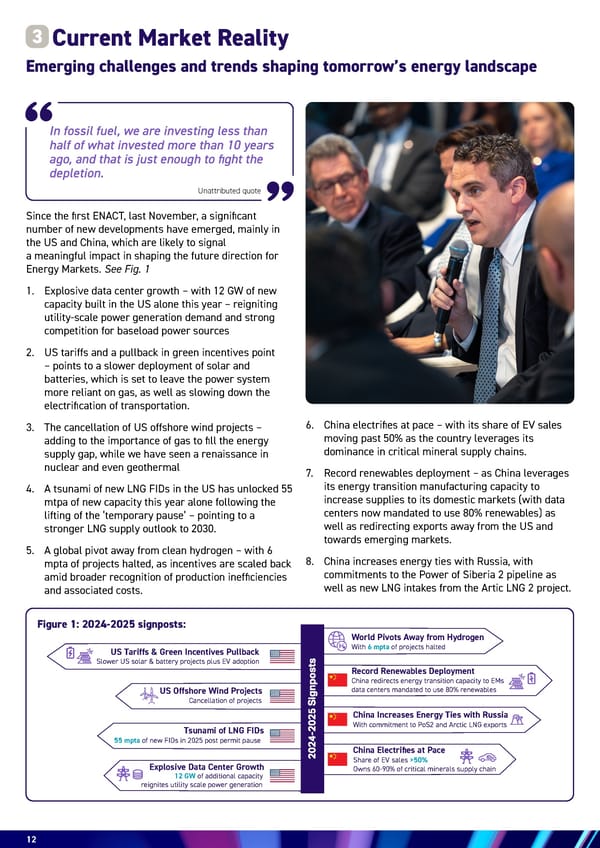
12 In fossil fuel, we are investing less than half of what invested more than 10 years ago, and that is just enough to fight the depletion. Since the first ENACT, last November, a significant number of new developments have emerged, mainly in the US and China, which are likely to signal a meaningful impact in shaping the future direction for Energy Markets. See Fig. 1 1. Explosive data center growth – with 12 GW of new capacity built in the US alone this year – reigniting utility-scale power generation demand and strong competition for baseload power sources 2. US tariffs and a pullback in green incentives point – points to a slower deployment of solar and batteries, which is set to leave the power system more reliant on gas, as well as slowing down the electrification of transportation. 3. The cancellation of US offshore wind projects – adding to the importance of gas to fill the energy supply gap, while we have seen a renaissance in nuclear and even geothermal 4. A tsunami of new LNG FIDs in the US has unlocked 55 mtpa of new capacity this year alone following the lifting of the ‘temporary pause’ – pointing to a stronger LNG supply outlook to 2030. 5. A global pivot away from clean hydrogen – with 6 mpta of projects halted, as incentives are scaled back amid broader recognition of production inefficiencies and associated costs. 6. China electrifies at pace – with its share of EV sales moving past 50% as the country leverages its dominance in critical mineral supply chains. 7. Record renewables deployment – as China leverages its energy transition manufacturing capacity to increase supplies to its domestic markets (with data centers now mandated to use 80% renewables) as well as redirecting exports away from the US and towards emerging markets. 8. China increases energy ties with Russia, with commitments to the Power of Siberia 2 pipeline as well as new LNG intakes from the Artic LNG 2 project. Current Market Reality Emerging challenges and trends shaping tomorrow’s energy landscape 3 Unattributed quote Tsunami of LNG FIDs 55 mpta of new FIDs in 2025 post permit pause US Tariffs & Green Incentives Pullback Slower US solar & battery projects plus EV adoption World Pivots Away from Hydrogen With 6 mpta of projects halted US Offshore Wind Projects Cancellation of projects Explosive Data Center Growth 12 GW of additional capacity reignites utility scale power generation China Increases Energy Ties with Russia With commitment to PoS2 and Arctic LNG exports China Electrifies at Pace Share of EV sales >50% Owns 60-90% of critical minerals supply chain Record Renewables Deployment China redirects energy transition capacity to EMs data centers mandated to use 80% renewables Figure 1: 2024-2025 signposts:
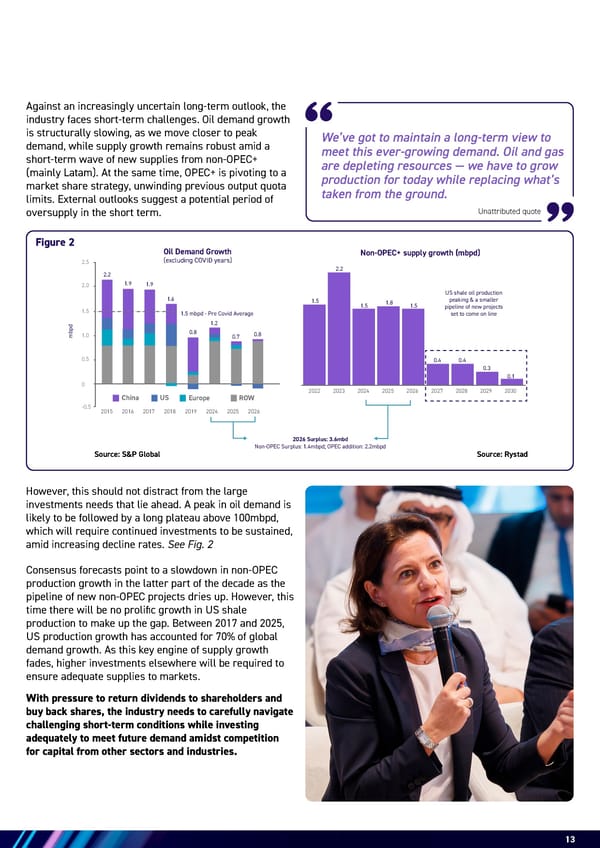
13 We’ve got to maintain a long-term view to meet this ever-growing demand. Oil and gas are depleting resources — we have to grow production for today while replacing what’s taken from the ground. 13 Against an increasingly uncertain long-term outlook, the industry faces short-term challenges. Oil demand growth is structurally slowing, as we move closer to peak demand, while supply growth remains robust amid a short-term wave of new supplies from non-OPEC+ (mainly Latam). At the same time, OPEC+ is pivoting to a market share strategy, unwinding previous output quota limits. External outlooks suggest a potential period of oversupply in the short term. Consensus forecasts point to a slowdown in non-OPEC production growth in the latter part of the decade as the pipeline of new non-OPEC projects dries up. However, this time there will be no prolific growth in US shale production to make up the gap. Between 2017 and 2025, US production growth has accounted for 70% of global demand growth. As this key engine of supply growth fades, higher investments elsewhere will be required to ensure adequate supplies to markets. With pressure to return dividends to shareholders and buy back shares, the industry needs to carefully navigate challenging short-term conditions while investing adequately to meet future demand amidst competition for capital from other sectors and industries. Unattributed quote However, this should not distract from the large investments needs that lie ahead. A peak in oil demand is likely to be followed by a long plateau above 100mbpd, which will require continued investments to be sustained, amid increasing decline rates. See Fig. 2 China US 1.2 0.8 1.9 1.6 2.2 1.9 1.0 1.5 2.5 2.0 0 0.5 mbpd Oil Demand Growth (excluding COVID years) Europe ROW -0.5 0.7 0.8 2024 2019 2017 2018 2015 2016 2025 2026 2.2 1.5 1.5 1.8 1.5 0.4 0.4 0.3 0.1 1.5 mbpd - Pre Covid Average 2027 2026 2024 2025 2022 2023 2028 2029 2030 US shale oil production peaking & a smaller pipeline of new projects set to come on line 2026 Surplus: 3.6mbd Non-OPEC Surplus: 1.4mbpd; OPEC addition: 2.2mbpd Non-OPEC+ supply growth (mbpd) Figure 2 Source: S&P Global Source: Rystad
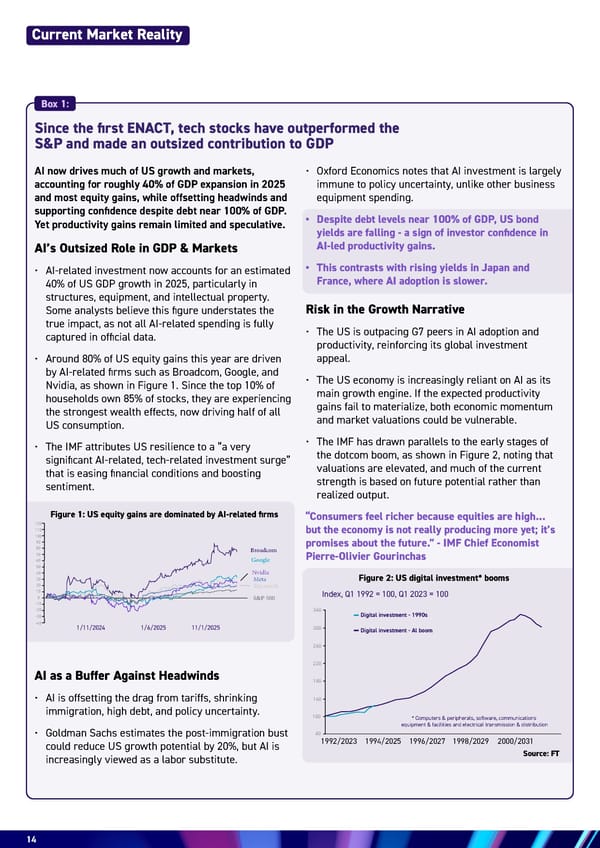
14 Current Market Reality AI now drives much of US growth and markets, accounting for roughly 40% of GDP expansion in 2025 and most equity gains, while offsetting headwinds and supporting confidence despite debt near 100% of GDP. Yet productivity gains remain limited and speculative. AI’s Outsized Role in GDP & Markets • AI-related investment now accounts for an estimated 40% of US GDP growth in 2025, particularly in structures, equipment, and intellectual property. Some analysts believe this figure understates the true impact, as not all AI-related spending is fully captured in official data. • Around 80% of US equity gains this year are driven by AI-related firms such as Broadcom, Google, and Nvidia, as shown in Figure 1. Since the top 10% of households own 85% of stocks, they are experiencing the strongest wealth effects, now driving half of all US consumption. • The IMF attributes US resilience to a “a very significant AI-related, tech-related investment surge” that is easing financial conditions and boosting sentiment. AI as a Buffer Against Headwinds • AI is offsetting the drag from tariffs, shrinking immigration, high debt, and policy uncertainty. • Goldman Sachs estimates the post-immigration bust could reduce US growth potential by 20%, but AI is increasingly viewed as a labor substitute. Since the first ENACT, tech stocks have outperformed the S&P and made an outsized contribution to GDP 1/11/2024 1/6/2025 11/1/2025 90 100 120 110 70 80 60 20 -20 30 -30 50 40 -40 0 10 -10 Broadcom Google Nvidia Meta Microsoft S&P 500 220 260 340 300 140 180 100 60 Index, Q1 1992 = 100, Q1 2023 = 100 Digital investment - 1990s Digital investment - Al boom * Computers & peripherals, software, communications equipment & facilities and electrical transmission & distribution 1992/2023 1994/2025 1996/2027 1998/2029 2000/2031 • Oxford Economics notes that AI investment is largely immune to policy uncertainty, unlike other business equipment spending. • Despite debt levels near 100% of GDP, US bond yields are falling - a sign of investor confidence in AI-led productivity gains. • This contrasts with rising yields in Japan and France, where AI adoption is slower. Risk in the Growth Narrative • The US is outpacing G7 peers in AI adoption and productivity, reinforcing its global investment appeal. • The US economy is increasingly reliant on AI as its main growth engine. If the expected productivity gains fail to materialize, both economic momentum and market valuations could be vulnerable. • The IMF has drawn parallels to the early stages of the dotcom boom, as shown in Figure 2, noting that valuations are elevated, and much of the current strength is based on future potential rather than realized output. “Consumers feel richer because equities are high... but the economy is not really producing more yet; it’s promises about the future.” - IMF Chief Economist Pierre-Olivier Gourinchas Source: FT Figure 1: US equity gains are dominated by AI-related firms Figure 2: US digital investment* booms Box 1:
15
16 While the rate of economic growth may be slowing, the total size of the economy continues to grow at pace, calling on the world to provide more energy. While economic growth may shift from energy-intensive industries to less energy-intensive services, energy providers will be challenged to meet the pace of growth intensified by a growing consumer middle class and a new energy- intensive sector: data centers. To keep up with economic progress, we will need to do more with less - producing more energy at lower cost, using less energy per unit of activity and producing more GDP per unit of energy (the economic principle of productivity). To create a more efficient energy system, the world will need to electrify at pace, even as data centers running on electrons add huge demand and a growing Global South will rely on more electricity for cooling. The pace of energy growth and transition to electricity will be constrained by the availability of capital and resources, making the long-term outlook very uncertain, as growth tries to balance between energy, capital, resource and carbon intensity to deliver an optimal energy outcome. Energy has played an essential role in shaping the progress of modern civilization, driving industrialization, improving living standards, and supporting technological advancements. Over the past century, fossil fuels, nuclear and hydro provided cost-effective, reliable sources of energy to power industry, technology, transport and our homes, with energy demand growing almost four-fold in the last 60 years. Over the past 40 years, these developments have fuelled remarkable global achievements, such as a 10-year increase in life expectancy, a rise in literacy rates from 70% to nearly 90%, and the lifting of over 1 billion people out of poverty. Central to this progress is the energy industry, which has provided the critical infrastructure and resources necessary to support industrial, commercial, and social growth. Since 1980, global energy demand has increased by 2.2 times, from 270 EJ to 592 EJ. This surge has underpinned growing wealth and sustained economic development with world GDP per capita almost doubling over the period. But it has also highlighted persistent inequalities: 750 million people still lacked access to electricity in 2021, and electricity consumption per capita in the Global North remains five times higher than in the Global South. Meeting the Growing Demand for Energy in Uncertain Times 4 Keeping up the next wave of AI and consumer-enabled growth Long-term trend: Energy is at the nexus of three mega trends
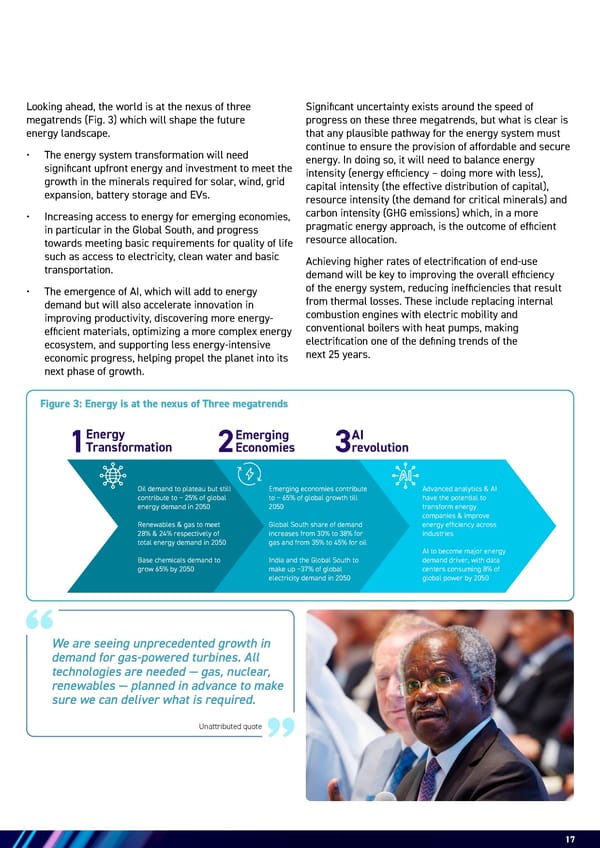
17 Figure 3: Energy is at the nexus of Three megatrends Looking ahead, the world is at the nexus of three megatrends (Fig. 3) which will shape the future energy landscape. • The energy system transformation will need significant upfront energy and investment to meet the growth in the minerals required for solar, wind, grid expansion, battery storage and EVs. • Increasing access to energy for emerging economies, in particular in the Global South, and progress towards meeting basic requirements for quality of life such as access to electricity, clean water and basic transportation. • The emergence of AI, which will add to energy demand but will also accelerate innovation in improving productivity, discovering more energy- efficient materials, optimizing a more complex energy ecosystem, and supporting less energy-intensive economic progress, helping propel the planet into its next phase of growth. Significant uncertainty exists around the speed of progress on these three megatrends, but what is clear is that any plausible pathway for the energy system must continue to ensure the provision of affordable and secure energy. In doing so, it will need to balance energy intensity (energy efficiency – doing more with less), capital intensity (the effective distribution of capital), resource intensity (the demand for critical minerals) and carbon intensity (GHG emissions) which, in a more pragmatic energy approach, is the outcome of efficient resource allocation. Achieving higher rates of electrification of end-use demand will be key to improving the overall efficiency of the energy system, reducing inefficiencies that result from thermal losses. These include replacing internal combustion engines with electric mobility and conventional boilers with heat pumps, making electrification one of the defining trends of the next 25 years. Unattributed quote Energy Transformation Emerging Economies AI revolution Oil demand to plateau but still contribute to ~ 25% of global energy demand in 2050 Renewables & gas to meet 28% & 24% respectively of total energy demand in 2050 Base chemicals demand to grow 65% by 2050 Emerging economies contribute to ~ 65% of global growth till 2050 Global South share of demand increases from 30% to 38% for gas and from 35% to 45% for oil India and the Global South to make up ~37% of global electricity demand in 2050 Advanced analytics & AI have the potential to transform energy companies & improve energy efficiency across industries AI to become major energy demand driver, with data centers consuming 8% of global power by 2050 1 2 3 We are seeing unprecedented growth in demand for gas-powered turbines. All technologies are needed — gas, nuclear, renewables — planned in advance to make sure we can deliver what is required.
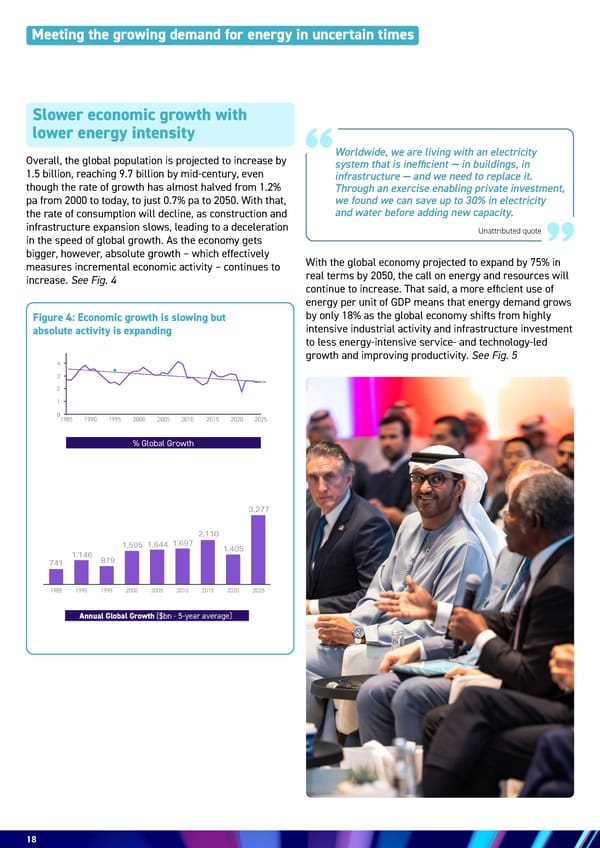
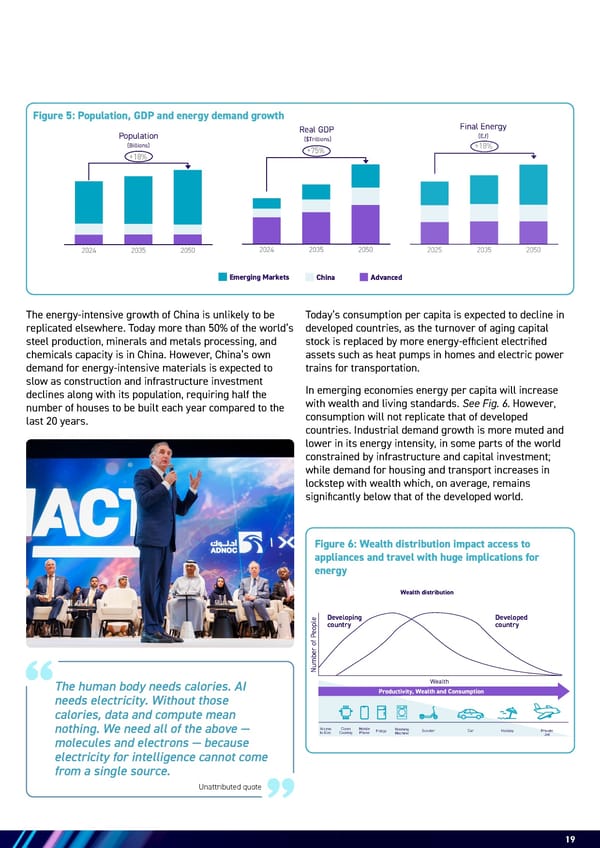
18 18 Meeting the growing demand for energy in uncertain times Overall, the global population is projected to increase by 1.5 billion, reaching 9.7 billion by mid-century, even though the rate of growth has almost halved from 1.2% pa from 2000 to today, to just 0.7% pa to 2050. With that, the rate of consumption will decline, as construction and infrastructure expansion slows, leading to a deceleration in the speed of global growth. As the economy gets bigger, however, absolute growth – which effectively measures incremental economic activity – continues to increase. See Fig. 4 Slower economic growth with lower energy intensity Figure 4: Economic growth is slowing but absolute activity is expanding Unattributed quote With the global economy projected to expand by 75% in real terms by 2050, the call on energy and resources will continue to increase. That said, a more efficient use of energy per unit of GDP means that energy demand grows by only 18% as the global economy shifts from highly intensive industrial activity and infrastructure investment to less energy-intensive service- and technology-led growth and improving productivity. See Fig. 5 0 1 2 3 4 5 1985 1990 1995 2000 2005 2010 2015 2020 2025 % Global Growth 741 1,146 879 1,595 1,644 1,697 2,110 1,405 3,277 1985 1990 1995 2000 2005 2010 2015 2020 2025 Annual Global Growth ($bn - 5-year average) Worldwide, we are living with an electricity system that is inefficient — in buildings, in infrastructure — and we need to replace it. Through an exercise enabling private investment, we found we can save up to 30% in electricity and water before adding new capacity.
Unattributed quote 19 The energy-intensive growth of China is unlikely to be replicated elsewhere. Today more than 50% of the world’s steel production, minerals and metals processing, and chemicals capacity is in China. However, China’s own demand for energy-intensive materials is expected to slow as construction and infrastructure investment declines along with its population, requiring half the number of houses to be built each year compared to the last 20 years. Figure 5: Population, GDP and energy demand growth Figure 6: Wealth distribution impact access to appliances and travel with huge implications for energy Developing country Number of People Developed country Wealth Access to Elec Clean Cooking Mobile Phone Fridge Scooter Car Holiday Washing Machine Wealth distribution Productivity, Wealth and Consumption Private Jet +18% 2024 2035 2050 Population (Billions) +75% 2024 2035 2050 +18% 2024 2035 2050 Real GDP ($Trillions) Final Energy (EJ) Emerging Markets China Advanced +18% 2025 2035 2050 Final Energy (EJ) Emerging Markets +18% 2024 2035 2050 Population (Billions) Real GDP ($Trillions) Final Energy (EJ) Emerging Markets China +18% 2024 2035 2050 Population (Billions) Real GDP ($Trillions) Final Energy (EJ) Emerging Markets China Advanced Today’s consumption per capita is expected to decline in developed countries, as the turnover of aging capital stock is replaced by more energy-efficient electrified assets such as heat pumps in homes and electric power trains for transportation. In emerging economies energy per capita will increase with wealth and living standards. See Fig. 6. However, consumption will not replicate that of developed countries. Industrial demand growth is more muted and lower in its energy intensity, in some parts of the world constrained by infrastructure and capital investment; while demand for housing and transport increases in lockstep with wealth which, on average, remains significantly below that of the developed world. The human body needs calories. AI needs electricity. Without those calories, data and compute mean nothing. We need all of the above — molecules and electrons — because electricity for intelligence cannot come from a single source.
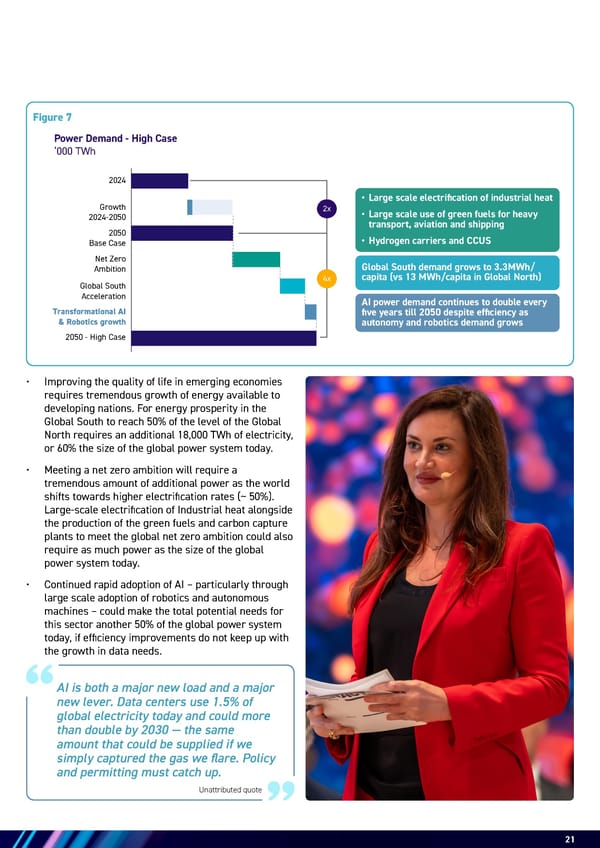
20 While significant uncertainty exists around the speed of the three mega-trends – and therefore of energy demand – a common feature of any outlook is the projection of a significant increase in power demand and higher levels of electrification. In base case, power demand doubles by 2050, with the share of electricity of final energy consumption increasing from 22% today to 35% in 2050. Significant variations exist across regions, with China reaching 45% by 2050, Europe 40%, North America 35% and the rest of the world increasing from around 19% today to ~30% by 2050. In addition to baseload growth in buildings (mostly cooling) and industry, the emergence of new sectors, such as AI, transport and low carbon markets, adds significantly to the demand for electricity, with these new sectors combined accounting for more than 30% of incremental power demand by 2050. In a case characterized by fast progression across all three megatrends, power demand could quadruple by 2050. See Fig. 7 Electrification of the energy system picks up pace Meeting the growing demand for energy in uncertain times Meeting a new generation of potential demand growth While the Global North is going through an energy transformation as its economies are electrified, turbo- charged by the battle for AI supremacy, in the Global South they have barely started the transition to access to reliable energy. Today: 1. 750m do not have access to electricity to provide very basic lighting and charge a phone or power a radio. 2. 2.4bn simply want access to clean cooking fuels, 3.2 milion people die each year due to household air pollution caused by cooking with polluting fuels 3. 1.2bn lack access to cooling/refrigeration, which contributes to the loss of 526 million tonnes of food produced annually 4. ~4bn people live below the modern energy minimum 5. ~3bn have no access to transportation, ~2bn without access to urban public transport and ~1bn live too far from roads 6. ~3.5bn are considered to live in poverty, with moderate poverty at ~$2,500/year per capita, with ~700m in extreme poverty at ~$785/year per capita, (compared with ~$65,000/year per capita in the US) Box 2: How quickly the Global South can move through the wealth ladder is a key uncertainty in the outlook given that the region will represents 70% of the global population by 2050 while accounting for less than 30% of energy demand today. Energy consumption per capita rises quickly as households progressively move towards more energy-intensive lifestyles, from their first appliance to their first vacation, creating large demand upside if more people than expected transition into the middle class enabled by AI or catalytic equity. Source: World Bank, ExxonMobil, WHO, Refrigeration World News
21 • Improving the quality of life in emerging economies requires tremendous growth of energy available to developing nations. For energy prosperity in the Global South to reach 50% of the level of the Global North requires an additional 18,000 TWh of electricity, or 60% the size of the global power system today. • Meeting a net zero ambition will require a tremendous amount of additional power as the world shifts towards higher electrification rates (~ 50%). Large-scale electrification of Industrial heat alongside the production of the green fuels and carbon capture plants to meet the global net zero ambition could also require as much power as the size of the global power system today. • Continued rapid adoption of AI – particularly through large scale adoption of robotics and autonomous machines – could make the total potential needs for this sector another 50% of the global power system today, if efficiency improvements do not keep up with the growth in data needs. Figure 7 Unattributed quote 2024 Growth 2024-2050 2050 Base Case Net Zero Ambition Global South Acceleration Transformational AI & Robotics growth 2050 - High Case Power Demand - High Case ‘000 TWh 2x 4x • Large scale electrification of industrial heat • Large scale use of green fuels for heavy transport, aviation and shipping • Hydrogen carriers and CCUS Global South demand grows to 3.3MWh/ capita (vs 13 MWh/capita in Global North) AI power demand continues to double every five years till 2050 despite efficiency as autonomy and robotics demand grows AI is both a major new load and a major new lever. Data centers use 1.5% of global electricity today and could more than double by 2030 — the same amount that could be supplied if we simply captured the gas we flare. Policy and permitting must catch up.
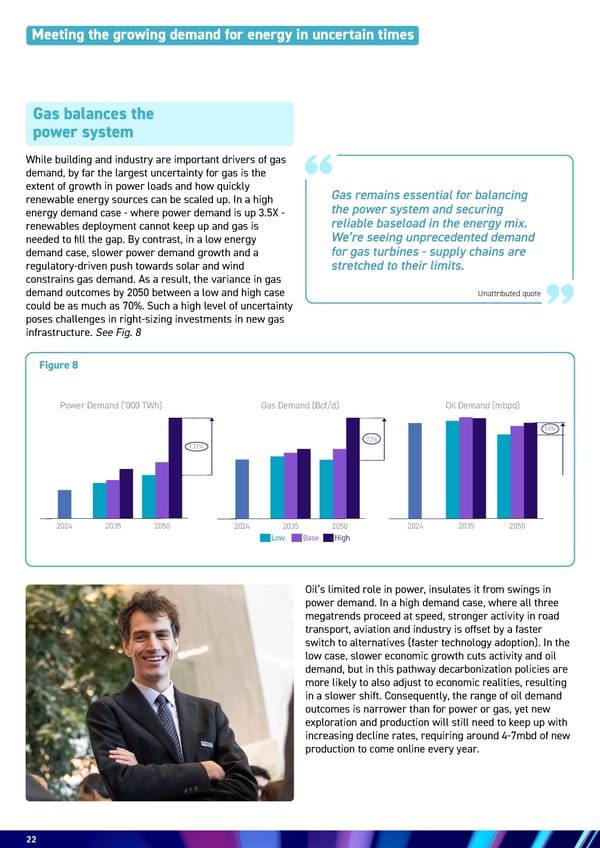
22 22 While building and industry are important drivers of gas demand, by far the largest uncertainty for gas is the extent of growth in power loads and how quickly renewable energy sources can be scaled up. In a high energy demand case - where power demand is up 3.5X - renewables deployment cannot keep up and gas is needed to fill the gap. By contrast, in a low energy demand case, slower power demand growth and a regulatory-driven push towards solar and wind constrains gas demand. As a result, the variance in gas demand outcomes by 2050 between a low and high case could be as much as 70%. Such a high level of uncertainty poses challenges in right-sizing investments in new gas infrastructure. See Fig. 8 Oil’s limited role in power, insulates it from swings in power demand. In a high demand case, where all three megatrends proceed at speed, stronger activity in road transport, aviation and industry is offset by a faster switch to alternatives (faster technology adoption). In the low case, slower economic growth cuts activity and oil demand, but in this pathway decarbonization policies are more likely to also adjust to economic realities, resulting in a slower shift. Consequently, the range of oil demand outcomes is narrower than for power or gas, yet new exploration and production will still need to keep up with increasing decline rates, requiring around 4-7mbd of new production to come online every year. Gas balances the power system Figure 8 Unattributed quote Meeting the growing demand for energy in uncertain times 131% 2024 2035 2050 72% 2024 2035 2050 14% 2024 2035 2050 Low Base High Power Demand (’000 TWh) Gas Demand (Bcf/d) Oil Demand (mbpd) Gas remains essential for balancing the power system and securing reliable baseload in the energy mix. We’re seeing unprecedented demand for gas turbines - supply chains are stretched to their limits.
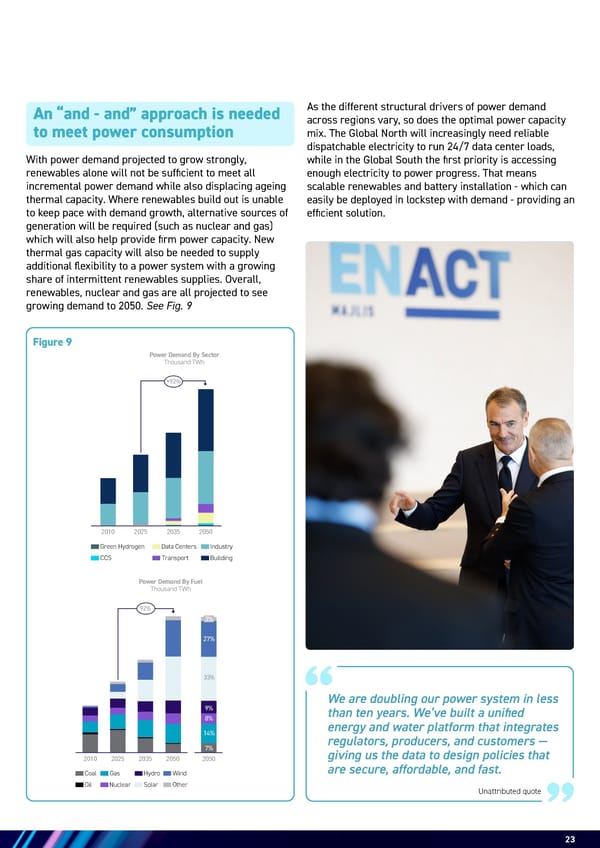
23 With power demand projected to grow strongly, renewables alone will not be sufficient to meet all incremental power demand while also displacing ageing thermal capacity. Where renewables build out is unable to keep pace with demand growth, alternative sources of generation will be required (such as nuclear and gas) which will also help provide firm power capacity. New thermal gas capacity will also be needed to supply additional flexibility to a power system with a growing share of intermittent renewables supplies. Overall, renewables, nuclear and gas are all projected to see growing demand to 2050. See Fig. 9 As the different structural drivers of power demand across regions vary, so does the optimal power capacity mix. The Global North will increasingly need reliable dispatchable electricity to run 24/7 data center loads, while in the Global South the first priority is accessing enough electricity to power progress. That means scalable renewables and battery installation - which can easily be deployed in lockstep with demand - providing an efficient solution. An “and - and” approach is needed to meet power consumption Figure 9 Unattributed quote Power Demand By Sector Thousand TWh Power Demand By Fuel Thousand TWh +92% Green Hydrogen CCS Transport Data Centers Industry Building 2010 2025 2035 2050 ector Power Demand By Fuel Thousand TWh 92% 2010 2025 2035 2050 2050 3% 27% 33% 9% 8% 14% 7% Coal Oil Nuclear Gas Hydro Wind Solar Other We are doubling our power system in less than ten years. We’ve built a unified energy and water platform that integrates regulators, producers, and customers — giving us the data to design policies that are secure, affordable, and fast.
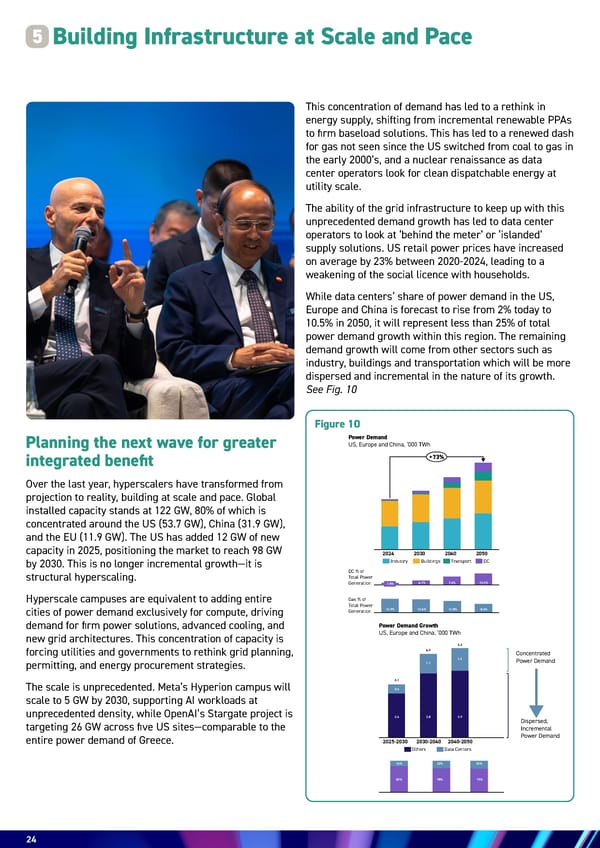
24 Over the last year, hyperscalers have transformed from projection to reality, building at scale and pace. Global installed capacity stands at 122 GW, 80% of which is concentrated around the US (53.7 GW), China (31.9 GW), and the EU (11.9 GW). The US has added 12 GW of new capacity in 2025, positioning the market to reach 98 GW by 2030. This is no longer incremental growth—it is structural hyperscaling. Hyperscale campuses are equivalent to adding entire cities of power demand exclusively for compute, driving demand for firm power solutions, advanced cooling, and new grid architectures. This concentration of capacity is forcing utilities and governments to rethink grid planning, permitting, and energy procurement strategies. The scale is unprecedented. Meta’s Hyperion campus will scale to 5 GW by 2030, supporting AI workloads at unprecedented density, while OpenAI’s Stargate project is targeting 26 GW across five US sites—comparable to the entire power demand of Greece. Building Infrastructure at Scale and Pace 5 Planning the next wave for greater integrated benefit This concentration of demand has led to a rethink in energy supply, shifting from incremental renewable PPAs to firm baseload solutions. This has led to a renewed dash for gas not seen since the US switched from coal to gas in the early 2000’s, and a nuclear renaissance as data center operators look for clean dispatchable energy at utility scale. The ability of the grid infrastructure to keep up with this unprecedented demand growth has led to data center operators to look at ‘behind the meter’ or ‘islanded’ supply solutions. US retail power prices have increased on average by 23% between 2020-2024, leading to a weakening of the social licence with households. While data centers’ share of power demand in the US, Europe and China is forecast to rise from 2% today to 10.5% in 2050, it will represent less than 25% of total power demand growth within this region. The remaining demand growth will come from other sectors such as industry, buildings and transportation which will be more dispersed and incremental in the nature of its growth. See Fig. 10 Figure 10 DC % of Total Power Generation 2024 2030 2040 2050 +73% DC Transport Buildings Industry 1.8% 4.1% 7.6% 10.5% Gas % of Total Power Generation 13.9% 13.6% 11.8% 8.6% Power Demand US, Europe and China, ‘000 TWh Drivers of develop Current USD (tm) Power Demand Growth US, Europe and China, ‘000 TWh 200 180 160 140 120 100 80 60 40 20 0 16 LICs* (today) *LICs E Concentrated Power Demand Dispersed, Incremental Power Demand 2025-2030 2030-2040 2040-2050 Others Data Centers 2.6 16% 82% 22% 25% 78% 75% 0.6 3.1 3.8 3.9 1.1 1.3 4.9 5.3 Power Demand Growth US, Europe and China, ‘000 TWh
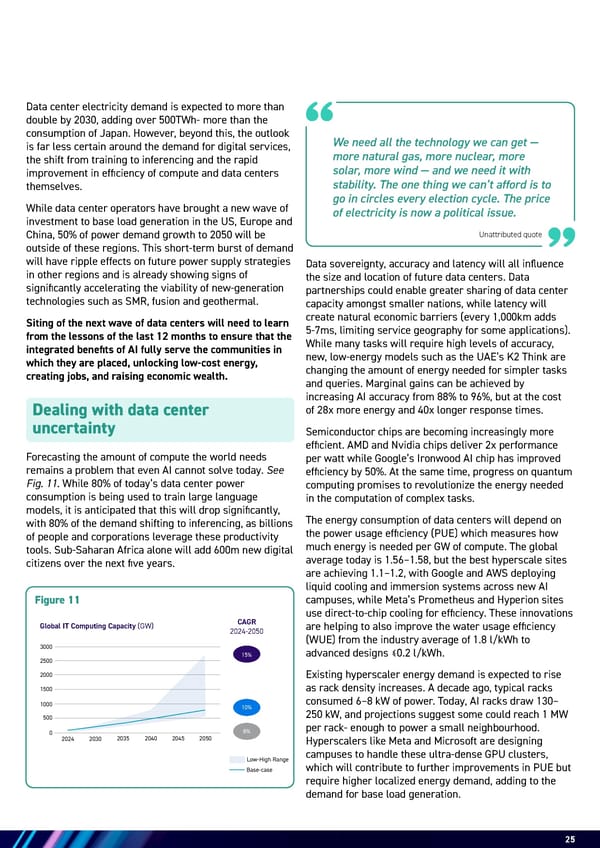
25 Figure 11 Data center electricity demand is expected to more than double by 2030, adding over 500TWh- more than the consumption of Japan. However, beyond this, the outlook is far less certain around the demand for digital services, the shift from training to inferencing and the rapid improvement in efficiency of compute and data centers themselves. While data center operators have brought a new wave of investment to base load generation in the US, Europe and China, 50% of power demand growth to 2050 will be outside of these regions. This short-term burst of demand will have ripple effects on future power supply strategies in other regions and is already showing signs of significantly accelerating the viability of new-generation technologies such as SMR, fusion and geothermal. Siting of the next wave of data centers will need to learn from the lessons of the last 12 months to ensure that the integrated benefits of AI fully serve the communities in which they are placed, unlocking low-cost energy, creating jobs, and raising economic wealth. Forecasting the amount of compute the world needs remains a problem that even AI cannot solve today. See Fig. 11. While 80% of today’s data center power consumption is being used to train large language models, it is anticipated that this will drop significantly, with 80% of the demand shifting to inferencing, as billions of people and corporations leverage these productivity tools. Sub-Saharan Africa alone will add 600m new digital citizens over the next five years. Dealing with data center uncertainty Data sovereignty, accuracy and latency will all influence the size and location of future data centers. Data partnerships could enable greater sharing of data center capacity amongst smaller nations, while latency will create natural economic barriers (every 1,000km adds 5-7ms, limiting service geography for some applications). While many tasks will require high levels of accuracy, new, low-energy models such as the UAE’s K2 Think are changing the amount of energy needed for simpler tasks and queries. Marginal gains can be achieved by increasing AI accuracy from 88% to 96%, but at the cost of 28x more energy and 40x longer response times. Semiconductor chips are becoming increasingly more efficient. AMD and Nvidia chips deliver 2x performance per watt while Google’s Ironwood AI chip has improved efficiency by 50%. At the same time, progress on quantum computing promises to revolutionize the energy needed in the computation of complex tasks. The energy consumption of data centers will depend on the power usage efficiency (PUE) which measures how much energy is needed per GW of compute. The global average today is 1.56–1.58, but the best hyperscale sites are achieving 1.1–1.2, with Google and AWS deploying liquid cooling and immersion systems across new AI campuses, while Meta’s Prometheus and Hyperion sites use direct-to-chip cooling for efficiency. These innovations are helping to also improve the water usage efficiency (WUE) from the industry average of 1.8 l/kWh to advanced designs ≤0.2 l/kWh. Existing hyperscaler energy demand is expected to rise as rack density increases. A decade ago, typical racks consumed 6–8 kW of power. Today, AI racks draw 130– 250 kW, and projections suggest some could reach 1 MW per rack- enough to power a small neighbourhood. Hyperscalers like Meta and Microsoft are designing campuses to handle these ultra-dense GPU clusters, which will contribute to further improvements in PUE but require higher localized energy demand, adding to the demand for base load generation. Unattributed quote 8% 15% 3000 Low-High Range 2500 2000 1500 500 1000 0 2050 10% Global IT Computing Capacity (GW) CAGR 2024-2050 Base-case 2050 2045 2035 2030 2024 2040 We need all the technology we can get — more natural gas, more nuclear, more solar, more wind — and we need it with stability. The one thing we can’t afford is to go in circles every election cycle. The price of electricity is now a political issue.
26 Unattributed quote The need for reliable base load power has seen a return to gas-powered generation around the key gas hubs of Texas and Louisiana, with Entergy adding 2.2GW of gas plants for Meta’s Louisiana Hyperion campus, planned to scale up to 5GW, and with Open AI/Soft Bank’s Stargate project in Texas expected to rely mainly on gas. As a result, after demand for gas turbines collapsed from 400 units per year to 110 units after the 2011 dash to switch from coal to gas in the US, this year global orders have shot up to 1,025 units, with 46% of sales to the US vs 29% historically. Large unit orders have increased 50% vs the 10-year average. Manufacturing is concentrated around three main suppliers. GE Vernova and Mitsubishi Heavy Industries, who have seen orders almost double from 40GW (2021- Gas bounces back 2023) to 70GW (2024-2026), and Siemens, who recently quoted US orders jumping from one unit years ago to closer to 200 today! Most order books are now full for the next five years with delivery times as long as seven years. Investment in the research and design of gas turbines by the “big three” has seen efficiency improve by 64%. China has recognized it cannot catch up with this technology, so has focused on renewables and in the short term has filled its base load gap with coal, which is why China’s share of gas in power will remain no more than 3%. The bottlenecks in supply are significantly impacting Asia (and consequently the demand for LNG). The cost of gas turbines has tripled over the last few years and, with the high cost of LNG (peaking at $75/mmbtu), has seen the levelized cost of electricity from gas increase, forcing emerging economies to rethink their energy strategies as China has flooded the market with cheap renewables. Vietnam will miss its 2030 target of increasing its gas generated power from 1.6GW to 22.3GW, with just one project having secured a gas turbine. In the need to fill the energy gap renewables may leapfrog gas. Building Infrastructure at Scale and Pace If we don’t change our approach to electricity pricing, the price of electricity will become what gasoline once was — the metric everyone knows, the issue every politician runs on. And if we’re not careful, that backlash will come fast.
27 27 With the US pivoting to the need for firm, scalable power sources to meet data center demand, existing nuclear plants, able to provide clean dispatchable energy, have seen a revival. Microsoft signed a 20-year power purchase agreement (PPA) with Constellation Energy to restart the 835 MW Three Mile Island Unit 1 reactor (renamed Crane Clean Energy Center), supplying carbon- free power to data centers in the PJM region by 2027. Talen Energy signed a PPA to supply power from the Susquehanna Nuclear Power plant to AWS’ 960MW Pennsylvania data center campus. Firm nuclear agreements remain limited to the extension or restart of existing plants. New nuclear technologies remain expensive, uncommercialized, and take years to develop, with very few reactors added to US grids this century. Nuclear renaissance However, California-based Deep Fission has signed nonbinding agreements to supply 12.5 GW of nuclear power—equivalent to more than 12 traditional reactors— mainly to data centers, amid rising demand for carbon- free energy. At the same time, technology firms are placing their bets in SMR technology. Amazon has partnered with X-energy to deploy Xe-100 small modular reactors (SMRs) near AWS data centers in Washington State. Each unit produces 80 MW, and Amazon aims to support up to 5 GW of nuclear capacity by 2039 through a $50 bn investment plan. Google is collaborating with Kairos Power to build seven SMRs delivering up to 500 MW by 2035, with the first unit expected online by 2030. Fusion technology is also gaining pace, with 42 private companies now in a race to deliver stable energy without the generation of nuclear waste. The Tennessee Valley Authority (TVA) is planning to start construction of Type One Energy’s stellarator fusion technology at the retired Bull Run coal plant by 2028. Sceptics still claim that the technology remains decades away. With the delay in the availability of turbines into the next decade, some see this as giving time for emerging technologies such as SMR, fusion and geothermal to catch up, adding to the growing uncertainty in the fuels mix beyond 2030. Unattributed quote We are seeing convergence of all energies — oil, gas, electricity — it’s no longer separate. We are building gigawatts of gas and renewables side by side. The only way to provide power for data centers is to combine both.
28 Building Infrastructure at Scale and Pace Unattributed quote China added 356GW of renewables in 2024 (277GW solar, 79GW wind) as total installed capacity surpassed that of thermal for the first time and accounted for 33.6% of generation as coal fell below 60% for the first time. New Chinese data centers must source at least 80% of their electricity from renewable energy by 2030 and verify this through the purchase and retirement of Green Energy Certificates (GECs), helping to maintain the pace of solar and wind deployment as current incentives are phased out. Rising power demand is creating grid bottlenecks, while permitting constraints are delaying the build-out of new transmission lines. Utilization of existing capacity is being enabled through better planning and operation of the grid, while battery storage is being used to increase utilization of existing generation, helping to shift peak demand from constrained parts of the grid. Tools like Alphabet’s Tapestry aim to modernize the electric grid using AI, making it more visible, reliable, affordable, and sustainable by building a “Google Maps for electrons”, mapping grid connections to optimize energy flows and planning, accelerating clean energy integration. Tools like Grid Planning and GridAware automate inspections, simulate scenarios, and support renewable site selection, resulting in 86% faster simulations and 30x more scenario runs, helping unlock stalled energy projects and reduce outages. Renewables follow the money Grid Constraints, behind the meter solutions and batteries While US tariffs and cuts in incentives have slowed down the pace of renewables additions, US solar output in June jumped 30.5% year-on-year and Chinese exports of solar modules rose 13% year-on-year to 236GW, shifting exports away from the US, with Europe importing almost 95GW and Brazil 22.5GW, while India and Pakistan each importing over 16GW. Geothermal is also gaining momentum thanks to the capital and demand for carbon-free energy for data centers. Google and Meta have both partnered with Fervo Energy to deploy enhanced geothermal systems (EGS) for 24/7 carbon-free power, but at 115 MW, geothermal deals show promise but remain small compared to hyperscale demand. According to Woodmac, about 1.5GW of Geothermal projects are in the current development pipeline of which 25% is targeted for data centers. 15GW of nuclear power plants to be built in the US - there’s been a flood of capital flowing back into the nuclear business
29 29 Unattributed quote There is rising opposition in the US and EU over power price hikes, water usage, and land rights for transmission lines, with social license risk becoming a material factor in project timelines and cost structures. Local elections in Europe have highlighted concerns over data center energy impacts. US households that heat with electricity will spend about 4% more this winter as power prices rise, even if weather is ~10% warmer. Electricity consumption is expected to average 1% lower than last winter as prices rise by 5% nationwide. Homes, primarily using electricity, will grow ~2% to over 57 million, while heating-oil homes will fall ~4%, according to the EIA. Weakening social licence Battery storage this year is set to increase by 104GW, up 44% from last year. Retired coal plants are being repurposed into large-scale battery storage sites, leveraging existing grid connections and infrastructure. Examples include Hawaii’s Kapolei Energy Storage system, which replaced the state’s last coal plant with a 185 MW battery, and DTE Energy’s Trenton Channel project in Michigan, converting a former coal site into a 220 MW battery center. These projects provide grid stability, store excess renewable power, and accelerate the clean energy transition. Many data center operators are securing private-wire agreements and on-site generation, including nuclear PPAs and gas-fired plants, ensuring uninterrupted power for hyperscale facilities. Modular, behind-the-meter power generation solutions are gaining traction among data center developers looking to bypass regulatory and interconnection hurdles, posing a growing challenge to independent power producers’ contracting model. Farmers opposed the $4.9bn Grain Belt Express power line, planned to carry wind power from Kansas to eastern states, citing land rights and compensation concerns, causing delays and lawsuits, while Google cancelled its Indiana campus after community pushback over water use and power demand. However, behind-the-meter or islanded supply arrangements do not optimize capacity or capital effectively. They do provide reliable 24/7 supply for data centers, usually with 100% spare capacity, but do not optimize the full extent of the grid, intended to be the “largest machine in the world” balancing supply across 100’s of producers with demand from millions of customers every second of the day. While data center loads can shift dramatically between training runs, building battery and planning systems to manage short- term fluctuations in supply or demand could enable data center operators to increase the utilization of their generating assets, providing lower cost electricity to local communities. The scale is real — we’re talking about over $10 trillion in power and data infrastructure. But the money exists. What’s missing is execution — building faster, smarter, and with the right structures to mobilize capital.
30 Building Infrastructure at Scale and Pace Unattributed quote While there is need to accelerate the speed of permitting (such as US Energy Secretary Chris Wright urging FERC to limit data center grid connection review periods, which typically take years, to 60 days) regulation to protect consumers and improve the planning process is required. Proposed rules include allowing customers to file joint, co-located load and generation interconnection requests, significantly reducing study times and grid upgrade costs, and reducing the time needed for additional generation and power to come online. Policymakers in the US and EU are debating frameworks to balance AI growth with grid reliability. Data centers could use 9% of US electricity by 2030, driving calls for efficiency standards and grid-aware computing. The EU AI Act requires GPAI providers to report energy consumption and compute resources in technical documentation. Obligations apply from Aug 2025, with full compliance by Aug 2027, aiming to curb rising AI energy demand and align with sustainability goals. Abu Dhabi’s Department of Energy and MBZUAI signed an MoU to integrate AI into energy planning and regulatory innovation, supporting Net Zero 2050, focused on AI- enabled forecasting, demand modelling, and smart infrastructure planning. Learning from the lessons of the last year and building from the actions of the previous two ENACT Majlises we have the opportunity to deliver the next wave of data centers more efficiently to maximize their economic benefits. Outside of the US, Europe and China, data center capacity will grow by almost 700%, equivalent to building twice all the existing capacity in six years and is forecast to face a shortfall of 2.3 million skilled workers. As a new energy-intense sector, data centers can be the solution for bringing new capital to energy markets and concentrated demand to enable investment in highly capital-intense power generation projects such as gas turbines, nuclear fission, geothermal and even fusion. Data centers will need to be sited around regional archetypes based around access to abundant low-cost energy, talent and resources able not just to consume but also to drive build out, integrated value such as water, cooling and heating (into residential, agriculture etc) and availability of capital. Collaboration will be required across governments and multiple sector champions, to develop a set of integrated transition policies that links AI and Energy planning with broader national goals, tailored to each country’s context based on: 1. Energy infrastructure maturity 2. AI ecosystem capability (access to energy, water & GPUs) 3. Technical maturity and talent to harvest the potential 4. Capital market accessibility Need for Regulation Delivering the next wave of data centers The digital revolution rests on physical foundations — molecules, metals, and grids. Every chip and data center needs energy, and that makes energy the most important geopolitical factor in the AI age.
31 Unattributed quote 31 AI and energy investment need to be aligned, building data center capacity in countries which are energy rich, providing access to compute capacity to countries who have the technology capabilities but not the infrastructure and generation capacity to keep up, while finding the right balance between compute capacity and energy for countries with limited foundations. The right partnerships will be needed between energy and technology leaders, with economic models developed to understand the economic benefits versus where the revenue is generated, which may not always be where the infrastructure sits. In the AI race, countries risk offering incentives and tax benefits which result in limited domestic economic benefit if sustainable jobs are not created, water scarcity impacts agriculture and there is a lack of access to affordable energy for all. On the other hand, the energy demand of today’s hyperscalers can be equivalent to the size of a city supporting 4m households. This can enable vast generation capacity to be built in one go near cities which lack reliable access to energy, built ready to meet future demand growth where otherwise the building at scale would have been uneconomic. This could unlock otherwise unfeasible hydroelectric, geothermal, nuclear or gas projects in places where the source of energy is abundant, unlocking the full potential of the country’s energy ecosystem. The benefits of data centers could be significant with the right planning, integrating water, heating and cooling for district and agricultural use. Building power generation capacity with co-located data centers built with redundancy could also provide low-cost non-guaranteed domestic power (which will inevitably be better than the current availability). We’ve cut permitting from years to weeks. Environmental Impact Statements that once took four years are now completed in under 28 days. When we accomplish this at scale, capital starts flowing — you can’t invest if you can’t get approval.
32 households or villages with local distributed energy systems which remove the need for vast amounts of transmission and large scale-generation, similar to Norway’s domestic battery incentive scheme. Sharing of best practice tools and applications can accelerate enablement. As the rest of the world grows and prospers, it can do so with a lower energy footprint by leveraging energy efficiency improvements such as building towns and cities using lessons learnt at Masdar City. It can also adopt regulation and standards that enable data centers to be better integrated into the energy system, setting regulations around forward planning of consumption, efficiency standards and emissions accounting where location- and market-based mechanisms along with renewable energy certificates (RECs) or guarantees of origins (REGOs) can be used in practical ways that can drive down the costs and emissions of the energy system, without unnecessarily penalizing one source or another. Building Infrastructure at Scale and Pace The sovereignty requirements of data and compute tasks need to be defined. Data partnerships should therefore determine the need between training capacity and inferencing speed, with data center location and fiber optic capacity effectively moving where energy is consumed. Equally, the energy intensity of the data models used can be optimized to the usage where often low-energy models, which compromise some accuracy, are fit for purpose and vastly reduce energy usage (such as the UAE’s K2 Think). The data and talent ecosystem can be strengthened through open data policies and investments into education and skills development to build an AI capable workforce and energy system. In developing countries, the workforce can be empowered by knowledge where AI is not replacing jobs but enabling small businesses to thrive, providing financial and legal support which would otherwise have been unaffordable, or providing AI can help: • Energy planning and grid optimization and resilience including the strategic placement of battery storage • Develop AI compute access strategies that balance domestic, sovereign and external needs, mapping the data ecosystem • Harness integrated benefits such as water, heating and cooling • Improve accounting methods to help drive down the cost, and emissions of power generation • Bring the capital needed to build generation capacity, including the acceleration of renewables and low carbon emissions energy such as SMRs and geothermal • Develop new economic architectures to provide the surge in capital required for the Intelligence Age Unattributed quote AI for the physical world — not just the digital — will change everything. Within three years, we’ll see AI design catalysts, batteries, and materials that slash costs by half. That will change the economics of infrastructure completely.
33 33 33
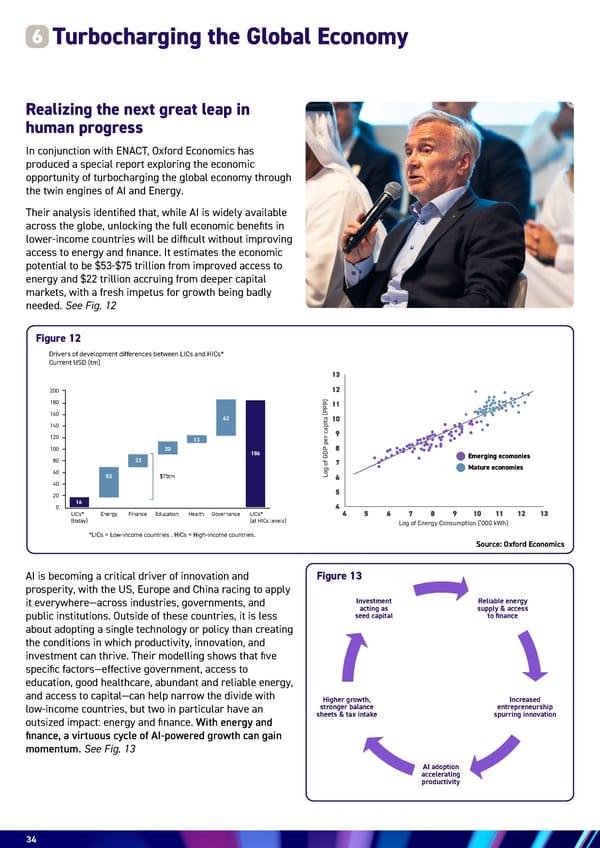
34 Turbocharging the Global Economy 6 In conjunction with ENACT, Oxford Economics has produced a special report exploring the economic opportunity of turbocharging the global economy through the twin engines of AI and Energy. Their analysis identified that, while AI is widely available across the globe, unlocking the full economic benefits in lower-income countries will be difficult without improving access to energy and finance. It estimates the economic potential to be $53-$75 trillion from improved access to energy and $22 trillion accruing from deeper capital markets, with a fresh impetus for growth being badly needed. See Fig. 12 AI is becoming a critical driver of innovation and prosperity, with the US, Europe and China racing to apply it everywhere—across industries, governments, and public institutions. Outside of these countries, it is less about adopting a single technology or policy than creating the conditions in which productivity, innovation, and investment can thrive. Their modelling shows that five specific factors—effective government, access to education, good healthcare, abundant and reliable energy, and access to capital—can help narrow the divide with low-income countries, but two in particular have an outsized impact: energy and finance. With energy and finance, a virtuous cycle of AI-powered growth can gain momentum. See Fig. 13 Realizing the next great leap in human progress Figure 12 Emerging ecomonies Log of Energy Consumption (‘000 kWh) Log of GDP per capita (PPP) Mature economies Source: Oxford Economics Figure 13 Employment in LICs stands to gain and lose relatively less Drivers of development differences between LICs and HICs* Current USD (tm) Employment shares by AI exposure and complementarity High exposure, low complementarity Low-income countries High-income countries High exposure, high complementarity Low exposure 200 180 160 140 120 100 80 60 40 20 0 $75tm 16 53 22 20 13 62 186 LICs* (today) *LICs = Low-income countries . HICs = High-income countries. LICs* (at HICs levels) Energy Finance Education Health Governance Reliable energy supply & access to finance Investment acting as seed capital Increased entrepreneurship spurring innovation AI adoption accelerating productivity Higher growth, stronger balance sheets & tax intake
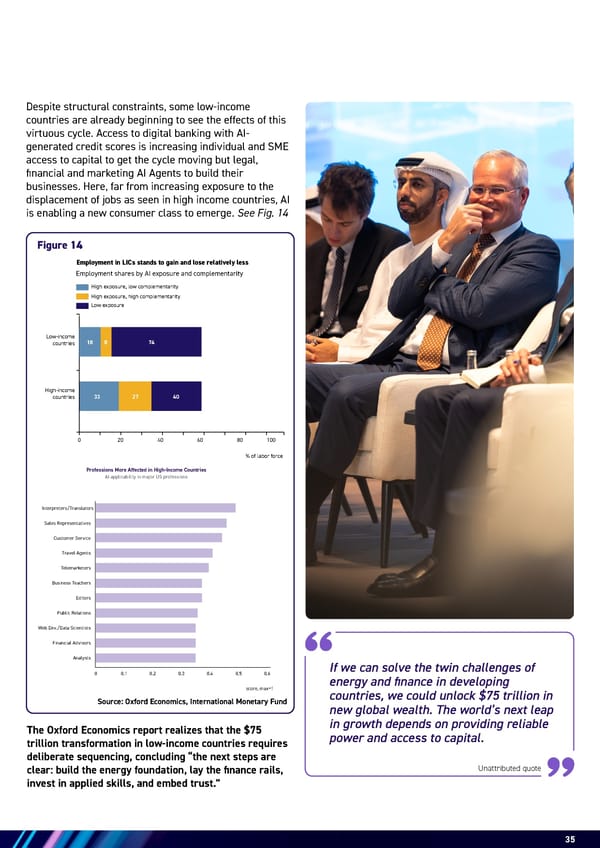
35 The Oxford Economics report realizes that the $75 trillion transformation in low-income countries requires deliberate sequencing, concluding “the next steps are clear: build the energy foundation, lay the finance rails, invest in applied skills, and embed trust.” Source: Oxford Economics, International Monetary Fund Figure 14 Employment in LICs stands to gain and lose relatively less Employment shares by AI exposure and complementarity High exposure, low complementarity Low-income countries High-income countries High exposure, high complementarity Low exposure % of labor force 0 20 40 60 80 100 18 33 27 40 8 74 score, max=1 Interpreters/Translators Sales Representatives Customer Service Travel Agents Telemarketers Business Teachers Editors Public Relations Web Dev./Data Scientists Financial Advisors Analysts Professions More Affected in High-Income Countries AI applicability in major US professions 0.1 0.2 0.3 0.4 0.5 0.6 0 Despite structural constraints, some low-income countries are already beginning to see the effects of this virtuous cycle. Access to digital banking with AI- generated credit scores is increasing individual and SME access to capital to get the cycle moving but legal, financial and marketing AI Agents to build their businesses. Here, far from increasing exposure to the displacement of jobs as seen in high income countries, AI is enabling a new consumer class to emerge. See Fig. 14 Unattributed quote If we can solve the twin challenges of energy and finance in developing countries, we could unlock $75 trillion in new global wealth. The world’s next leap in growth depends on providing reliable power and access to capital.
36 Funding the Growth 7 Calls to halt investment in fossil fuels were premature. Demand for oil in 2050 will have barely fallen from today’s levels and as such, so we must at least sustain the current level of investment and continue to invest in innovation, to produce harder-to-access oil and increase the recovery rate from existing fields. Today’s operators, with the help of AI, are becoming smarter, building topside capacity to limit initial peak production but maintain production for longer, upgrading recoverable oil estimates to prolong this production and minimize costs, which has helped to drive today’s oil prices below the long-term average of $73/bbl in 2024 real terms. The rate of electrification in the Global North and some industrial heartlands of the Global South will simply not be able to scale up renewables fast enough or reliably enough to satisfy growing demand for electricity. Electrification will grow from 22% of energy demand to 35% in 2050 (or 51% in a high case). While renewables will account for 85% of new installed capacity, gas will play a significant role in replacing retiring inefficient coal generation capacity (800GW of Coal retirements anticipated 2024-2050) and meeting the demand gap. As domestic gas demand in the US and Europe peaks, and production in Asia declines as it increasingly industrialises and needs increased dispatchable power loads, LNG demand will grow ~70% to resolve the regional imbalance. Efficient & effective distribution of capital to unlock global growth AI and the Intelligence Age will not run on code alone, but will require an abundance of kW to achieve their potential. Islanded data centers with their own power generation will evolve to support the power consumption of a city the size of Dubai, requiring reliable energy to run training models 24/7. The uncertainty in data center power demand is significant, with the base case assuming The world requires vast amounts of materials as it prospers, building huge cities of steel and cement, industrial plants and the infrastructure that connects it all together. The electrification of our energy system will add to this materials demand, with the associated demand for these metals being 1% of total energy demand alone. Petrochemicals will play an increasing role in substituting more energy-intensive materials, increasing from 6% of core materials (excluding lumber). While the world may need abundant affordable energy, it needs to make choices along the way. Getting the speed of transformation right can help to reduce energy demand, emissions, materials and capital, but it is a complex jigsaw to solve. See Call Out Box 3 global demand will grow 10-fold from 71GW today to 800GW in 2050, but the range of analyst views is wide, with the US alone (38% of data center demand) ranging from 220GW to 950GW in 2050. Yet let’s not get carried away – while data centers share of electricity demand will grow from 1.5% today to 8% in 2050, we have a lot of work to do to keep the lights on across the globe. This year, keeping the lights on has caught a lot of media attention. Today’s grid languishes in the 20th Century, relying on transformers with an average age of between 24 and 45 years. The grid is the largest machine in the world, connecting spinning generating capacity to thousands of spinning motors, all vulnerable to the smallest of changes in grid’s frequency. As the power system increasingly relies on renewable generation, the grid capacity needs to be increased three to four times that of conventional thermal power capacity, adding to the challenge of bringing the grid into the 21st Century. In the US alone, the grid will need 70,000 miles of additional transmission capacity by 2035, yet last year only 350miles of capacity was built. At that rate we will only have enough capacity by 2235 not 2035! Unattributed quote There’s $40 trillion sitting in sovereign and pension funds. It’s not about the money — it’s about execution. We need to rewire the financial system so that capital can flow into power and data infrastructure.
37 BEV PHEV FFV New ICE On Road ICE 11 19 34 34 43 -41% LDV Energy Consumption per Vehicle (GJ/yr) 36 143 96 148 189 241 208 112 BEV* PHEV FFV New ICE On Road ICE PHEV- Green Case -24% -22% Cumulative Carbon Intensity per vehicle (gCO2e/Km) 1.67 1.38 Energy Payback Time for Different Power Technologies (Years) Hydro Solar Geothermal Wind Coal Gas Nuclear 0.58 0.58 0.17 0.14 0.12 LDV Energy Consumption per Vehicle (GJ/yr) 36 143 96 148 189 241 208 112 BEV* PHEV FFV New ICE On Road ICE PHEV- Green Case -24% -22% Cumulative Carbon Intensity per vehicle (gCO2e/Km) 1.67 1.38 Energy Payback Time for Different Power Technologies (Years) Hydro Solar Geothermal Wind Coal Gas Nuclear 0.58 0.58 0.17 0.14 0.12 36 143 96 148 189 241 208 112 BEV* PHEV FFV New ICE On Road ICE PHEV- Green Case -24% -22% 36 143 96 148 189 241 208 112 BEV* PHEV FFV New ICE On Road ICE PHEV- Green Case -24% -22% Cumulative Carbon Intensity per vehicle (gCO2e/Km) Electrification is a key enabler of the energy transformation when it provides efficiency gains, even if decarbonization of the electricity produced occurs over time. Electric vehicles have much higher engine efficiency than ICE (90% vs.30%), which translates to EVs being a lower carbon intensity option even when the electricity is generated via gas. Only when the marginal source of electricity is coal do EVs have a negative emission impact – although early switching is still beneficial due to the lag times necessary to replace the existing fleet (avg. car age 15-20 years) and allow the reaping of the benefits of a future decarbonized grid. Similarly, heat pumps with 300% efficiency and coal do 73% less energy consumption than conventional gas boilers result in 45% carbon savings per unit of heat provided even when electricity is sourced from gas. On the other end of the spectrum, efuels (combining green hydrogen + DAC) while being zero-emission, are incredibly energy inefficient with end-use efficiencies (process + use) below 15%. With the average CO2 intensity of the grid still roughly at par with gas (121 gCO2e/MJ), the energy waste associated with eFuels can be detrimental to the de-carbonization of the Optimizing the Energy system: Energy Efficiency, Carbon & Resource Intensity An efficient energy system transformation requires the whole system to be optimized across energy efficiency, carbon intensity and resource intensity, finding optimal trade-offs for each sector. Achieving a zero-carbon solution at the end user level might still prove a suboptimal solution, if associated with energy waste throughout the production process, or a disproportionate increase in the call on material/ minerals and resources. * Range based on average grid intensity to 100% coal in China. 1.67 1.38 Hydro Solar Geothermal Wind Coal Gas Nuclear 0.58 0.58 0.17 0.14 0.12 BEV PHEV FFV New ICE On Road ICE 11 19 34 34 43 -41% LDV Energy Consumption per Vehicle (GJ/yr) 36 14 PH PHEV- Green Case Cumulative C 1.67 1.38 Energy Payback Time for Different Power Technologies (Years) Box 3: overall system as it cannibalizes green electrons which can be used elsewhere. Moreover, achieving green electrification is, in itself, a source of additional energy demand, given the higher material intensity of renewable energy infrastructure vs. conventional alternatives. In the case of efuels, this additional energy might risk bringing the already low process efficiency even closer to zero. The embodied energy of solar and wind (i.e. the amount of energy needed to produce the material required for one unit of power produced) is almost 10 times that of gas due to larger infrastructure material requirements and lower load factors, which result in much higher payback times for clean power technologies than fossil fuels. The reliance on silicon in the case of solar, and concrete in the case of hydro, makes the energy payback times of these two technologies particularly high. Thus, when direct electrification is not possible and molecules are required, pairing conventional fossil fuels with DAC offer, a better decarbonization option than eFuels, as the latter suffer from the double whammy of high energy and material intensity (associated with the build-up of renewables capacity) and the energy losses derived from converting electricity into molecules. In fact, the overall production efficiency of eJet is 25%, versus a total process efficiency of producing Jet while offsetting its emission (of use) with DAC of ~ 60%.
38 Investments Breakdown by type Energy Data Centers Other Infrastructure Others 77% 11% 4% 7% $35 Trillions p.a. Total investment in the global economy is around $25 trillion p.a. today and is expected to grow to above $40 trillion by 2050. Investments in energy and data center infrastructure are projected to account for 11% of the total, or around $4 trillion p.a, as the world ramps up efforts to electrify the energy system and build data center clusters to expand AI. This will include laying out the necessary infrastructure to connect households and businesses in an increasingly integrated infrastructure ecosystem. See Fig. 15 & 16 These investments in energy and data center infrastructure are on top of those needed in other sectors such as transport (e.g. airports, roads and ports), water, waste, and agriculture, which are needed to keep up with population growth and economic development as well as replacing ageing assets mainly in developed economies. Taken together, infrastructure investments could amount to $8 trillion p.a, or almost a quarter of total global investment. Power or electricity will need to attract a growing share of investments and capital in the energy system, with grids (transmission and distribution) in particular taking a much larger share than they have historically. In 2015, energy supply investments totalled $2 trillion, with the power sector accounting for 49% and grids for 11% of the total. By 2024, energy supply investments had risen to $2.4 trillion, with the share of the power sector increasing to 64% and that of grid to 17%. Over the next 25 years we forecast the power sector will account for almost 70% of total investments in energy supply, with the share of grids increasing to 26%. See Fig. 17 Such a significant ramp-up in the investment requirements of the power sector is a function of a broad push towards electrification – which, in itself, is a capital- intense transformation and distribution of energy. Energy is not produced but is transformed in the electrification process, with the transportation of this low-density energy carrier being the most expensive and capital heavy segment of the whole power infrastructure chain (power generation assets; transmission; distribution and storage). Today, the world spends roughly $600 billion p.a. for oil and gas production, which is 10% less than the rate of investment required in power grids between now and 2050. On top of this, investments in new generation capacity – to meet both incremental power demand and replace retiring thermal (and later, renewables) assets – as well as energy storage will be required. Competition for capital in a capital-constrained world Transformation and distribution of electricity is capital-Intensive... Figure 15 Figure 16 Unattributed quote Funding the Growth Data Center Investments ($ Billions, annual average over period) 2024-2030 US, EU and China ROW 2030-2040 2040-2050 84% 16% 850 90% 80% 10% 20% 1,153 1,610 Corporate balance sheets can’t absorb this build-out. Companies should monetize their infrastructure — sell pipelines, grids, and transmission assets to infrastructure funds — and reinvest in their core businesses. That’s how we fund growth.
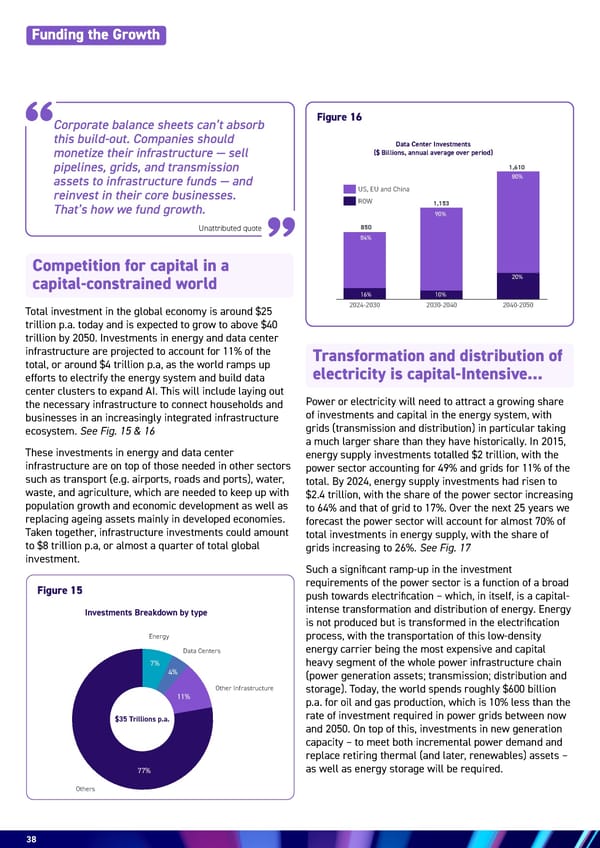
39 ...while electrifying at scale is resource intensive... The full energy efficiency benefits of electrification, however, can only be yielded if the improvements at the end-user level are not lost through an increase in thermal power generation and its associated combustion losses. Thus, only if the increase in power generation is predominantly matched via renewables sources can the full benefits be realized. While electrification via renewables allows the highest levels of energy efficiency to be preserved throughout the combined production-consumption process, renewables are more resource- and material-intensive than conventional generation. Wind needs six to seven times the amount of concrete and three times the amount of steel per MW of capacity than a gas power plant needs. Similarly, solar needs significantly more copper, aluminium, glass and silicon, all of which are energy- intensive materials. The material intensity of solar and wind is then amplified by their lower load factor. For utility-scale solar, load factors tend to vary between 15% and 25%. This means that, to generate the same amount of electricity generated by 1 MW of gas capacity, you will need an average of 2-4 MW of solar capacity. This can be significantly improved with the use of batteries, but doing that adds an additional call on upfront capital and resources. See Fig. 18 The ratione of undergoing these heavy upfront capital investments lies in the significant energy efficiency benefits that electrification yields at the end-user level, See Call Out Box 3. Electric vehicles are three times more efficient than ICEs, and heat pumps are 300% more energy efficient than conventional gas boilers. Grid Clean Energy Supply Fossil Power Generation Fossil Fuel Supply 2,500 2,471 2,021 2015 2024 2025-2050 Overall Energy Supply Investments ($Billion, real 2025) Grid 1,700 2015 2024 Clean Energy Supply & Grids Investments ($Billion, real 2025) 1,325 555 2025-2050 Battery Storage Solar Wind Nuclear Figure 17
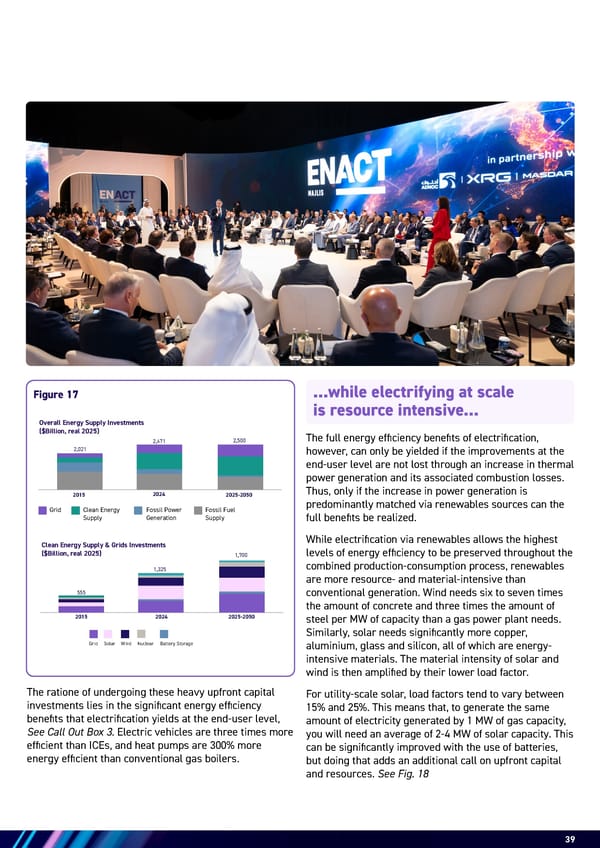
40 Figure 18: Power Generation – Material Intensity Funding the Growth In shaping the future energy system, the industry needs to address competing priorities, finding optimal trade-offs as it tries to optimize along the dimensions of energy demand, capital, materials and emissions. A good example of this system-wise optimization would be to build the right capacity mix in each country/region, fully taking into consideration the cost structure of different power technologies, including regional variations in capital costs, fuel costs, demand characteristics and risk exposures. Unattributed quote ...leading to the need for smart investment choices We’ve proven that when you fix permitting, capital flows. The Energy Dominance Council has shown that , when you reduce environmental review from years to days, the private sector steps up with record investment.
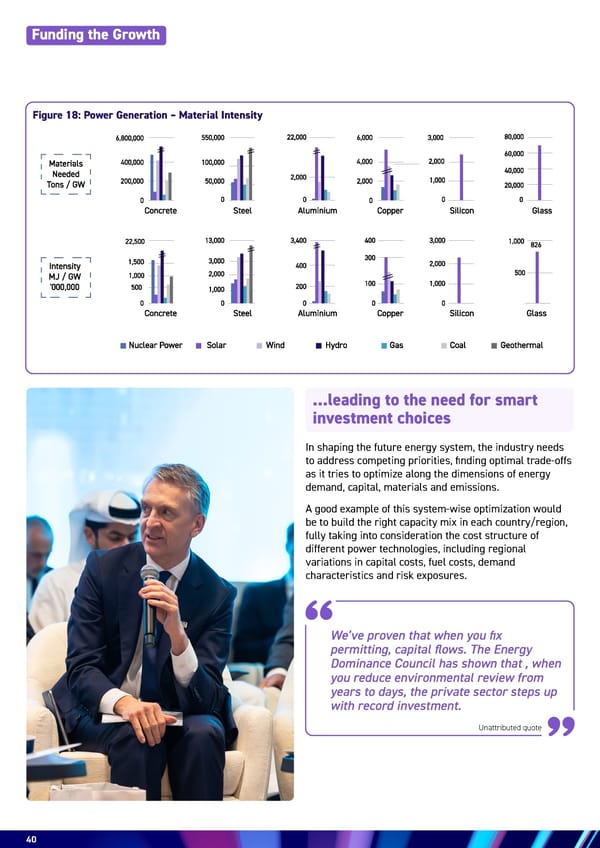
41 Figure 19 58 90 120 84 129 145 98 115 159 CCGT @ 3.5 $/Mmbtu CCGT @ S65/bbl 12.5% slope CCGT@ 10.5 $/Mmbtu US LNG Contract LNG Spot @ 35% LF @ 90% LF @ 50% LF Commodity and Carbon Price Risk Execution Risk Long-term Cost Declines Solar PV Utilility Solar PV Utilility + Storage Onshore Wind Nuclear 190 150 150 100 80 60 S/MWh 200 150 100 50 0 65 40 For countries with ample resources of cheap gas (such as the US), combined cycle gas turbines (CCGTs) are by far the best baseload option. Despite the recent steep escalation in capital costs (with the cost for a gas turbine now pegged at ~ $2,500/KW or three times as much as two years ago), the levelized cost of electricity of a CCGT, at a 90% load factor, is around half that of a solar+ battery system and two-to-three times lower than that of a nuclear plant. Moreover, for gas producing countries, the execution risks associated with the build-out of a nuclear plant and the reliability of 24/7 solar+ battery systems are a bigger risk considerations than the commodity price risk. Unattributed quote By contrast, for gas importing countries, the optimal choice is not so clear cut. While gas might still be a better choice than solar for pure base-load modes, at a typical grid-level utilization load factor of around 50%, solar + storage systems start to look competitive. Moreover, the risk of commodity price spikes is likely to weigh more prominently in investment decisions, particularly considering the wild price swings in LNG prices over the past few years. As a result, before making the capital commitment for a large gas plant, investors are more likely to lock in long-term contracts for gas against a Brent slope to reduce price risk volatility, thus committing up front to capital and operational expenses before producing a single kW of energy amidst most likely an uncertain demand outlook. And herein lies the benefit of data centers to guarantee offtake via power purchase agreements (PPAs). See Fig. 19 We are at the start of a golden age of private capital for infrastructure. The money is there — $100 trillion in sovereign and pension funds — but permitting is the bottleneck. Fix that, and the capital will flow.
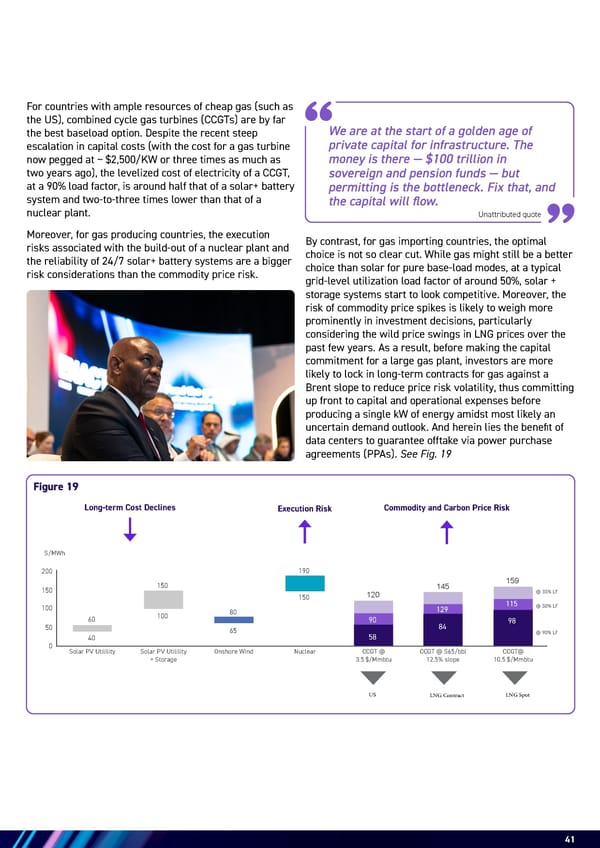
42 While gas power generation may appear cheaper on an LCOE basis, the economics are highly dependent on the assumed load factor (LF), as highlighted in Fig 19. However, with the exception of data centers, it is seldom that all the demand comes at once or is in one place. As a result, levelized costs of electricity should also take into account the infrastructure (grid) and up-front capital required. Infrastructure-light solutions can cut down the upfront capital required but often cost more per kW. However, with availability of cheap solar PV modules and batteries from China, renewables can be placed close to the source of demand and scaled with demand growth, reducing the upfront capital and the need for expensive infrastructure, with the benefit of limiting running costs. With planning, the strategic deployment of infrastructure- light distributed energy systems could significantly reduce the cost of access to energy and, with innovative financing such as enterprise-backed credit obligations for future capacity (ECO capacity) or catalytic equity to seed economic development (such as from Alterra), could unlock huge economic potential. Infrastructure-light solutions should not be limited to energy: • Digital access is often constrained by connectivity and latency to data centers. Low-orbit satellite broadband can cut down latency over large distances, reducing the need to bury fiber optics over long and often impassible terrains. The DRC partnered with Japan’s Solafune to use AI and satellite data for mineral exploration, enabling real-time geological insights, improving resource governance, and combating illicit mining. A $400m satellite project with Monacosat aims to expand high-speed internet access and support AI-driven applications in telemedicine, e-learning, and cybersecurity, especially in underserved regions. • Harvesting water from the atmosphere is not only a solution to water stress in an increasingly arid world, but also cuts down the need for infrastructure or the transportation and containment of water. Professor Omar Yaghi won this year’s Nobel Prize in Chemistry for a scientific breakthrough that his startup is now on the verge of commercializing, and will be targeting data centers in the US. The harvesters don’t require electricity and can produce ultrapure water using just ambient sunlight or waste heat from data centers and other industrial facilities. • Drones have become commonplace in modern warfare because they are cheap, efficient and not constrained by geography. As such they are a technology ready to carry not only warheads, but to deliver medicines, goods, food etc to less accessible areas, reducing the need for roads, bridges and tunnels. The infrastructure-light future of transportation will cut down the need for the amount of transport infrastructure in use today, just as mobile phones have transformed the need for landline infrastructure. With help from AI, we can design an infrastructure-light world which needs less capital, less energy and less resources to turbo-charge the global economy. In a capital-constrained world, infrastructure-light solutions may be needed Unattributed quote Funding the Growth The governments that move first to signal demand — for turbines, for grid upgrades, for gas plants — will win. AI can transform the physical world, but only if we send the right demand signals to industry now.
43 Proposed Solutions 8 Turbo-charge the Global Economy through Well-Funded Energy and AI OPTIMIZING THE ENERGY SYSTEM • Energy mapping to balance supply and demand and minimize energy, resource and capital intensity. • Optimize the grid, understanding centralized & distributed solutions • Build battery siting and optimization models and policies to maximize load factors and optimize grid usage • Support energy efficiency alliance to increase the efficiency of energy consumption, sharing AI tools and applications. • Produce energy infrastructure maturity assessment • Accelerate new tech generation • Better demands side management of Data Center usage and future baseload requirements. IMPROVE ACCESS TO, AND USE OF, CAPITAL • Define new capital market models which are more aligned to production capacity and minimizing the LCOE of the energy system, not individual projects • Drive adoption of new financial models such as catalytic equity and enterprise-backed credit to unlock capacity • Accelerate low-cost infrastructure-light solutions to increase access to energy intelligence • Increase access to online banking for all and easier access to credit scores MAXIMIZING THE VALUE OF DATA CENTER SITING • Defining archetypes for the next wave of sitings outside of US & China • Agreeing data partnerships to overcome constraints of data sovereignty • Aligning community integration with data centers for win-win solutions, including demand-side management tools. • Develop data center standards for use of market vs location-based accounting and efficiency • Develop regional tech maturity and talent scores Unattributed quote For the first time in human history, you can take a kilowatt of electricity and turn it directly into intelligence. But we cannot achieve the dream of artificial intelligence without more power. Power is knowledge now.