
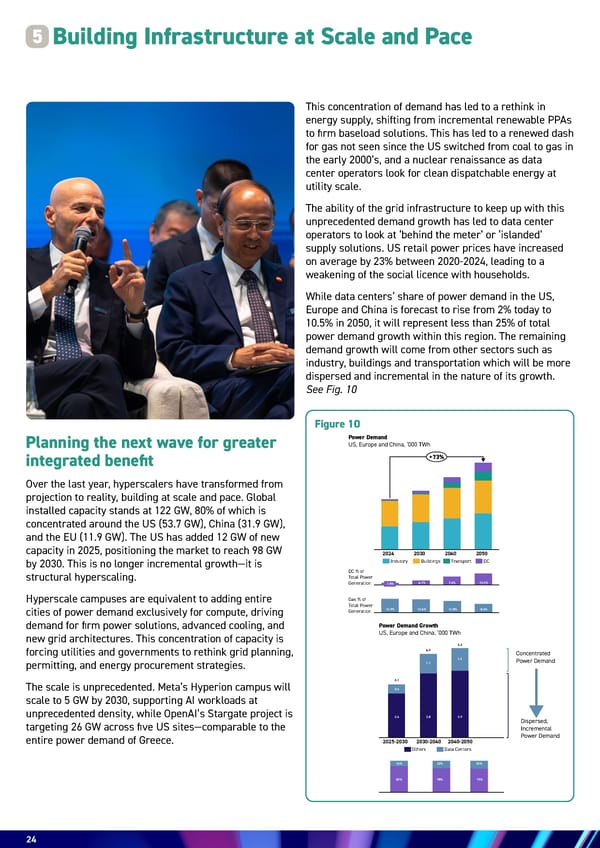
24 Over the last year, hyperscalers have transformed from projection to reality, building at scale and pace. Global installed capacity stands at 122 GW, 80% of which is concentrated around the US (53.7 GW), China (31.9 GW), and the EU (11.9 GW). The US has added 12 GW of new capacity in 2025, positioning the market to reach 98 GW by 2030. This is no longer incremental growth—it is structural hyperscaling. Hyperscale campuses are equivalent to adding entire cities of power demand exclusively for compute, driving demand for firm power solutions, advanced cooling, and new grid architectures. This concentration of capacity is forcing utilities and governments to rethink grid planning, permitting, and energy procurement strategies. The scale is unprecedented. Meta’s Hyperion campus will scale to 5 GW by 2030, supporting AI workloads at unprecedented density, while OpenAI’s Stargate project is targeting 26 GW across five US sites—comparable to the entire power demand of Greece. Building Infrastructure at Scale and Pace 5 Planning the next wave for greater integrated benefit This concentration of demand has led to a rethink in energy supply, shifting from incremental renewable PPAs to firm baseload solutions. This has led to a renewed dash for gas not seen since the US switched from coal to gas in the early 2000’s, and a nuclear renaissance as data center operators look for clean dispatchable energy at utility scale. The ability of the grid infrastructure to keep up with this unprecedented demand growth has led to data center operators to look at ‘behind the meter’ or ‘islanded’ supply solutions. US retail power prices have increased on average by 23% between 2020-2024, leading to a weakening of the social licence with households. While data centers’ share of power demand in the US, Europe and China is forecast to rise from 2% today to 10.5% in 2050, it will represent less than 25% of total power demand growth within this region. The remaining demand growth will come from other sectors such as industry, buildings and transportation which will be more dispersed and incremental in the nature of its growth. See Fig. 10 Figure 10 DC % of Total Power Generation 2024 2030 2040 2050 +73% DC Transport Buildings Industry 1.8% 4.1% 7.6% 10.5% Gas % of Total Power Generation 13.9% 13.6% 11.8% 8.6% Power Demand US, Europe and China, ‘000 TWh Drivers of develop Current USD (tm) Power Demand Growth US, Europe and China, ‘000 TWh 200 180 160 140 120 100 80 60 40 20 0 16 LICs* (today) *LICs E Concentrated Power Demand Dispersed, Incremental Power Demand 2025-2030 2030-2040 2040-2050 Others Data Centers 2.6 16% 82% 22% 25% 78% 75% 0.6 3.1 3.8 3.9 1.1 1.3 4.9 5.3 Power Demand Growth US, Europe and China, ‘000 TWh
 Energy & AI: Twin Engines Turbo-Charging Economic Growth Page 23 Page 25