
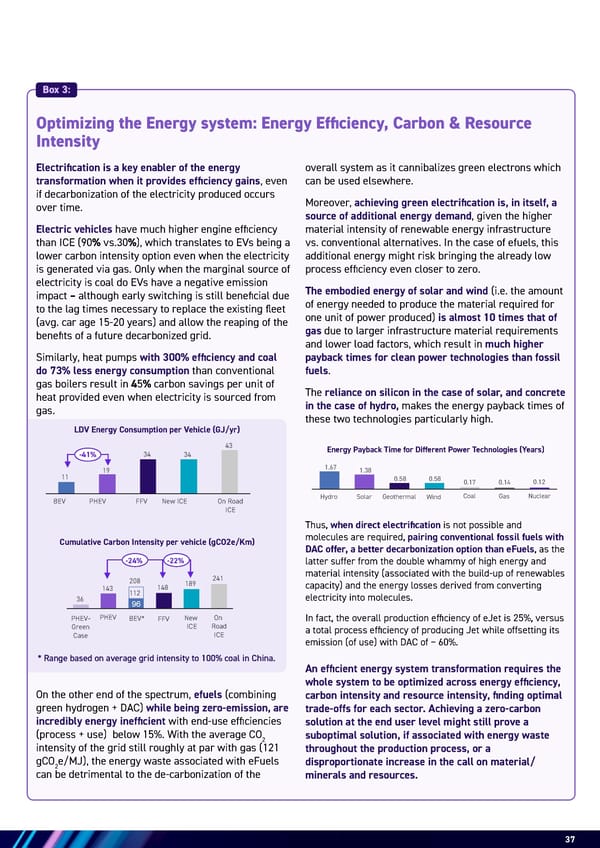
37 BEV PHEV FFV New ICE On Road ICE 11 19 34 34 43 -41% LDV Energy Consumption per Vehicle (GJ/yr) 36 143 96 148 189 241 208 112 BEV* PHEV FFV New ICE On Road ICE PHEV- Green Case -24% -22% Cumulative Carbon Intensity per vehicle (gCO2e/Km) 1.67 1.38 Energy Payback Time for Different Power Technologies (Years) Hydro Solar Geothermal Wind Coal Gas Nuclear 0.58 0.58 0.17 0.14 0.12 LDV Energy Consumption per Vehicle (GJ/yr) 36 143 96 148 189 241 208 112 BEV* PHEV FFV New ICE On Road ICE PHEV- Green Case -24% -22% Cumulative Carbon Intensity per vehicle (gCO2e/Km) 1.67 1.38 Energy Payback Time for Different Power Technologies (Years) Hydro Solar Geothermal Wind Coal Gas Nuclear 0.58 0.58 0.17 0.14 0.12 36 143 96 148 189 241 208 112 BEV* PHEV FFV New ICE On Road ICE PHEV- Green Case -24% -22% 36 143 96 148 189 241 208 112 BEV* PHEV FFV New ICE On Road ICE PHEV- Green Case -24% -22% Cumulative Carbon Intensity per vehicle (gCO2e/Km) Electrification is a key enabler of the energy transformation when it provides efficiency gains, even if decarbonization of the electricity produced occurs over time. Electric vehicles have much higher engine efficiency than ICE (90% vs.30%), which translates to EVs being a lower carbon intensity option even when the electricity is generated via gas. Only when the marginal source of electricity is coal do EVs have a negative emission impact – although early switching is still beneficial due to the lag times necessary to replace the existing fleet (avg. car age 15-20 years) and allow the reaping of the benefits of a future decarbonized grid. Similarly, heat pumps with 300% efficiency and coal do 73% less energy consumption than conventional gas boilers result in 45% carbon savings per unit of heat provided even when electricity is sourced from gas. On the other end of the spectrum, efuels (combining green hydrogen + DAC) while being zero-emission, are incredibly energy inefficient with end-use efficiencies (process + use) below 15%. With the average CO2 intensity of the grid still roughly at par with gas (121 gCO2e/MJ), the energy waste associated with eFuels can be detrimental to the de-carbonization of the Optimizing the Energy system: Energy Efficiency, Carbon & Resource Intensity An efficient energy system transformation requires the whole system to be optimized across energy efficiency, carbon intensity and resource intensity, finding optimal trade-offs for each sector. Achieving a zero-carbon solution at the end user level might still prove a suboptimal solution, if associated with energy waste throughout the production process, or a disproportionate increase in the call on material/ minerals and resources. * Range based on average grid intensity to 100% coal in China. 1.67 1.38 Hydro Solar Geothermal Wind Coal Gas Nuclear 0.58 0.58 0.17 0.14 0.12 BEV PHEV FFV New ICE On Road ICE 11 19 34 34 43 -41% LDV Energy Consumption per Vehicle (GJ/yr) 36 14 PH PHEV- Green Case Cumulative C 1.67 1.38 Energy Payback Time for Different Power Technologies (Years) Box 3: overall system as it cannibalizes green electrons which can be used elsewhere. Moreover, achieving green electrification is, in itself, a source of additional energy demand, given the higher material intensity of renewable energy infrastructure vs. conventional alternatives. In the case of efuels, this additional energy might risk bringing the already low process efficiency even closer to zero. The embodied energy of solar and wind (i.e. the amount of energy needed to produce the material required for one unit of power produced) is almost 10 times that of gas due to larger infrastructure material requirements and lower load factors, which result in much higher payback times for clean power technologies than fossil fuels. The reliance on silicon in the case of solar, and concrete in the case of hydro, makes the energy payback times of these two technologies particularly high. Thus, when direct electrification is not possible and molecules are required, pairing conventional fossil fuels with DAC offer, a better decarbonization option than eFuels, as the latter suffer from the double whammy of high energy and material intensity (associated with the build-up of renewables capacity) and the energy losses derived from converting electricity into molecules. In fact, the overall production efficiency of eJet is 25%, versus a total process efficiency of producing Jet while offsetting its emission (of use) with DAC of ~ 60%.
 Energy & AI: Twin Engines Turbo-Charging Economic Growth Page 36 Page 38