
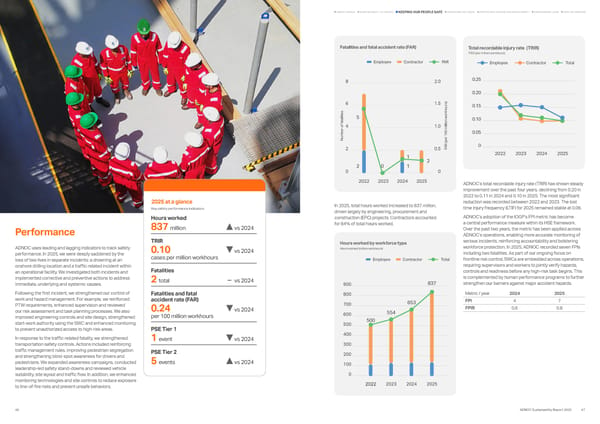
Hours worked by workforce type Contractor Employee Total 0 100 200 300 400 500 600 700 800 900 2022 2023 2024 2025 500 554 653 837 2022 2023 2024 2025 Hours worked (million workhours) 2022 2023 2024 2025 In 2025, total hours worked increased to 837 million, driven largely by engineering, procurement and construction (EPC) projects. Contractors accounted for 84% of total hours worked. Total recordable injury rate (TRIR) Contractor Employee Total 0 0.05 0.10 0.15 0.20 0.25 2022 2023 2024 2025 TRIR (per million workhours) ADNOC’s total recordable injury rate (TRIR) has shown steady improvement over the past four years, declining from 0.20 in 2022 to 0.11 in 2024 and 0.10 in 2025. The most significant reduction was recorded between 2022 and 2023. The lost time injury frequency (LTIF) for 2025 remained stable at 0.06. ADNOC’s adoption of the IOGP’s FPI metric has become a central performance measure within its HSE framework. Over the past two years, the metric has been applied across ADNOC’s operations, enabling more accurate monitoring of serious incidents, reinforcing accountability and bolstering workforce protection. In 2025, ADNOC recorded seven FPIs including two fatalities. As part of our ongoing focus on frontline risk control, SWCs are embedded across operations, requiring supervisors and workers to jointly verify hazards, controls and readiness before any high-risk task begins. This is complemented by human performance programs to further strengthen our barriers against major accident hazards. Metric / year 2024 2025 FPI 4 7 FPIR 0.6 0.8 Hours worked 837 million vs 2024 TRIR 0.10 vs 2024 cases per million workhours Fatalities 2 total – vs 2024 Fatalities and fatal accident rate (FAR) 0.24 vs 2024 per 100 million workhours PSE Tier 1 1 event vs 2024 PSE Tier 2 5 events vs 2024 2025 at a glance Key safety performance indicators Performance ADNOC uses leading and lagging indicators to track safety performance. In 2025, we were deeply saddened by the loss of two lives in separate incidents: a drowning at an onshore drilling location and a traffic-related incident within an operational facility. We investigated both incidents and implemented corrective and preventive actions to address immediate, underlying and systemic causes. Following the first incident, we strengthened our control of work and hazard management. For example, we reinforced PTW requirements, enhanced supervision and reviewed our risk assessment and task planning processes. We also improved engineering controls and site design, strengthened start‑work authority using the SWC and enhanced monitoring to prevent unauthorized access to high‑risk areas. In response to the traffic-related fatality, we strengthened transportation safety controls. Actions included reinforcing traffic management rules, improving pedestrian segregation and strengthening blind-spot awareness for drivers and pedestrians. We expanded awareness campaigns, conducted leadership-led safety stand‑downs and reviewed vehicle suitability, site layout and traffic flow. In addition, we enhanced monitoring technologies and site controls to reduce exposure to line‑of‑fire risks and prevent unsafe behaviors. Fatalities and fatal accident rate (FAR) FAR (per 100 million workhours) Contractor Employee FAR 0 0.5 1.0 1.5 2.0 0 2 4 6 8 2022 5 2 2025 2 2024 1 2023 0 1 Number of fatalities 47 ADNOC Sustainability Report 2025 46 KEEPING OUR PEOPLE SAFE ADVANCING NET ZERO EMPOWERING LIVES HOW WE OPERATE SUSTAINABILITY AT ADNOC ABOUT ADNOC PROTECTING NATURE AND BIODIVERSITY
 Sustainability Report 2025: Delivering Responsibly Page 22 Page 24