
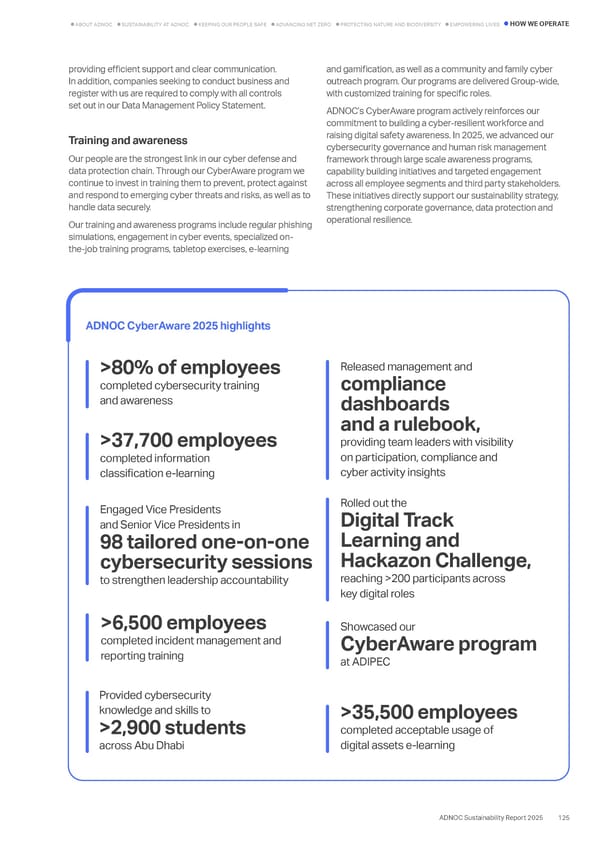
providing efficient support and clear communication. In addition, companies seeking to conduct business and register with us are required to comply with all controls set out in our Data Management Policy Statement. Training and awareness Our people are the strongest link in our cyber defense and data protection chain. Through our CyberAware program we continue to invest in training them to prevent, protect against and respond to emerging cyber threats and risks, as well as to handle data securely. Our training and awareness programs include regular phishing simulations, engagement in cyber events, specialized on- the-job training programs, tabletop exercises, e-learning and gamification, as well as a community and family cyber outreach program. Our programs are delivered Group-wide, with customized training for specific roles. ADNOC’s CyberAware program actively reinforces our commitment to building a cyber-resilient workforce and raising digital safety awareness. In 2025, we advanced our cybersecurity governance and human risk management framework through large scale awareness programs, capability building initiatives and targeted engagement across all employee segments and third party stakeholders. These initiatives directly support our sustainability strategy, strengthening corporate governance, data protection and operational resilience. >80% of employees completed cybersecurity training and awareness >37,700 employees completed information classification e-learning Engaged Vice Presidents and Senior Vice Presidents in 98 tailored one‑on‑one cybersecurity sessions to strengthen leadership accountability >6,500 employees completed incident management and reporting training Released management and compliance dashboards and a rulebook, providing team leaders with visibility on participation, compliance and cyber activity insights Rolled out the Digital Track Learning and Hackazon Challenge, reaching >200 participants across key digital roles Showcased our CyberAware program at ADIPEC Provided cybersecurity knowledge and skills to >2,900 students across Abu Dhabi >35,500 employees completed acceptable usage of digital assets e-learning ADNOC CyberAware 2025 highlights 125 ADNOC Sustainability Report 2025 HOW WE OPERATE KEEPING OUR PEOPLE SAFE ADVANCING NET ZERO EMPOWERING LIVES SUSTAINABILITY AT ADNOC ABOUT ADNOC PROTECTING NATURE AND BIODIVERSITY
 Sustainability Report 2025: Delivering Responsibly Page 122 Page 124