
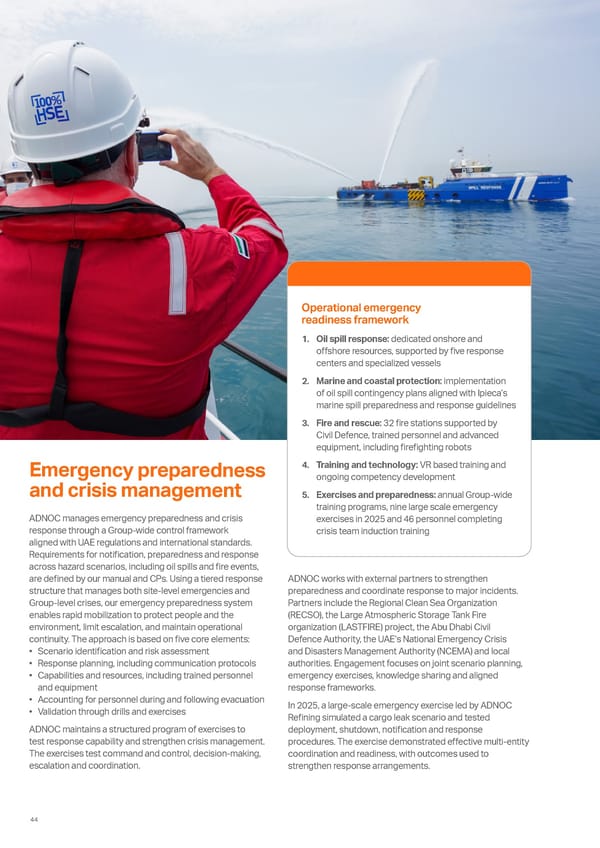
Emergency preparedness and crisis management ADNOC manages emergency preparedness and crisis response through a Group-wide control framework aligned with UAE regulations and international standards. Requirements for notification, preparedness and response across hazard scenarios, including oil spills and fire events, are defined by our manual and CPs. Using a tiered response structure that manages both site-level emergencies and Group-level crises, our emergency preparedness system enables rapid mobilization to protect people and the environment, limit escalation, and maintain operational continuity. The approach is based on five core elements: • Scenario identification and risk assessment • Response planning, including communication protocols • Capabilities and resources, including trained personnel and equipment • Accounting for personnel during and following evacuation • Validation through drills and exercises ADNOC maintains a structured program of exercises to test response capability and strengthen crisis management. The exercises test command and control, decision‑making, escalation and coordination. Operational emergency readiness framework 1. Oil spill response: dedicated onshore and offshore resources, supported by five response centers and specialized vessels 2. Marine and coastal protection: implementation of oil spill contingency plans aligned with Ipieca’s marine spill preparedness and response guidelines 3. Fire and rescue: 32 fire stations supported by Civil Defence, trained personnel and advanced equipment, including firefighting robots 4. Training and technology: VR based training and ongoing competency development 5. Exercises and preparedness: annual Group-wide training programs, nine large scale emergency exercises in 2025 and 46 personnel completing crisis team induction training ADNOC works with external partners to strengthen preparedness and coordinate response to major incidents. Partners include the Regional Clean Sea Organization (RECSO), the Large Atmospheric Storage Tank Fire organization (LASTFIRE) project, the Abu Dhabi Civil Defence Authority, the UAE’s National Emergency Crisis and Disasters Management Authority (NCEMA) and local authorities. Engagement focuses on joint scenario planning, emergency exercises, knowledge sharing and aligned response frameworks. In 2025, a large‑scale emergency exercise led by ADNOC Refining simulated a cargo leak scenario and tested deployment, shutdown, notification and response procedures. The exercise demonstrated effective multi‑entity coordination and readiness, with outcomes used to strengthen response arrangements. 44
 Sustainability Report 2025: Delivering Responsibly Page 41 Page 43