
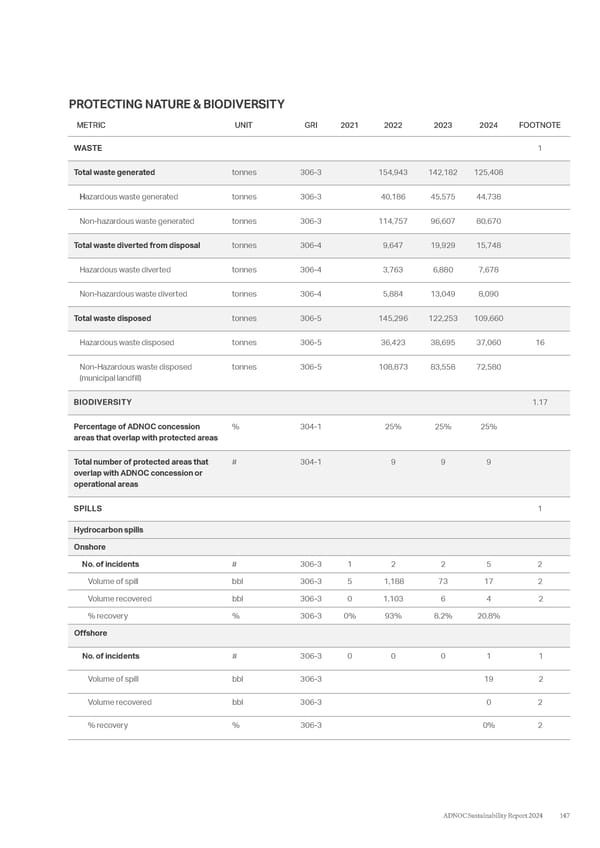
PROTECTING NATURE & BIODIVERSITY METRIC UNIT GRI 2021 2022 2023 2024 FOOTNOTE WASTE 1 Total waste generated tonnes 306-3 154,943 142,182 125,408 H azardous waste generated tonnes 306-3 40,186 45,575 44,738 Non-hazardous waste generated tonnes 306-3 114,757 96,607 80,670 Total waste diverted from disposal tonnes 306-4 9,647 19,929 15,748 Hazardous waste diverted tonnes 306-4 3,763 6,880 7,678 Non-hazardous waste diverted tonnes 306-4 5,884 13,049 8,090 Total waste disposed tonnes 306-5 145,296 122,253 109,660 Hazardous waste disposed tonnes 306-5 36,423 38,695 37,060 16 Non-Hazardous waste disposed (municipal landfill) tonnes 306-5 108,873 83,558 72,580 BIODIVERSITY 1.17 Percentage of ADNOC concession areas that overlap with protected areas % 304-1 25% 25% 25% Total number of protected areas that overlap with ADNOC concession or operational areas # 304-1 9 9 9 SPILLS 1 Hydrocarbon spills Onshore No. of incidents # 306-3 1 2 2 5 2 Volume of spill bbl 306-3 5 1,188 73 17 2 Volume recovered bbl 306-3 0 1,103 6 4 2 % recovery % 306-3 0% 93% 8.2% 20.8% Offshore No. of incidents # 306-3 0 0 0 1 1 Volume of spill bbl 306-3 19 2 Volume recovered bbl 306-3 0 2 % recovery % 306-3 0% 2 147 ADNOC Sustainability Report 2024
 ADNOC Sustainability Report 2024: Driving Progress & Prosperity Page 146 Page 148