
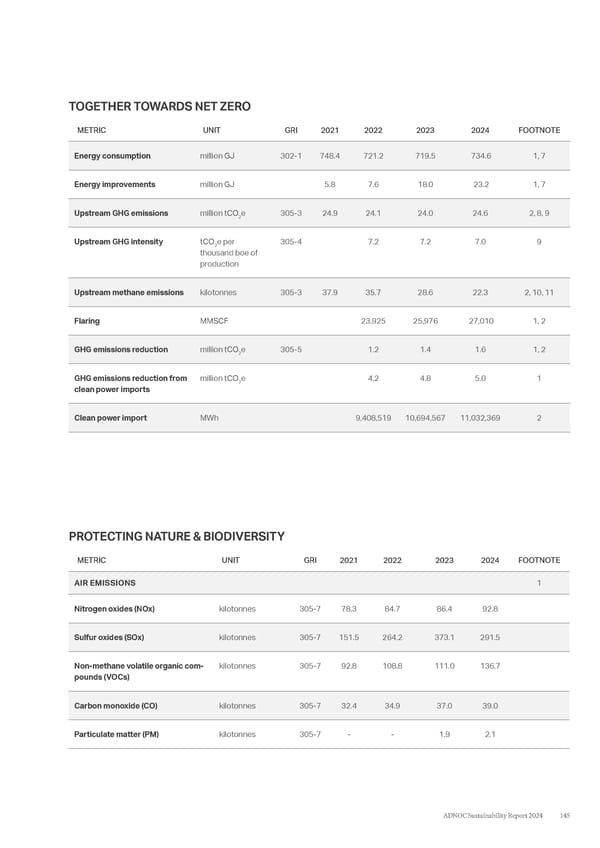
METRIC UNIT GRI 2021 2022 2023 2024 FOOTNOTE Energy consumption million GJ 302-1 748.4 721.2 719.5 734.6 1, 7 Energy improvements million GJ 5.8 7.6 18.0 23.2 1, 7 Upstream GHG emissions million tCO 2 e 305-3 24.9 24.1 24.0 24.6 2, 8, 9 Upstream GHG intensity tCO 2 e per thousand boe of production 305-4 7.2 7.2 7.0 9 Upstream methane emissions kilotonnes 305-3 37.9 35.7 28.6 22.3 2, 10, 11 Flaring MMSCF 23,925 25,976 27,010 1, 2 GHG emissions reduction million tCO 2 e 305-5 1.2 1.4 1.6 1, 2 GHG emissions reduction from clean power imports million tCO 2 e 4.2 4.8 5.0 1 Clean power import MWh 9,408,519 10,694,567 11,032,369 2 TOGETHER TOWARDS NET ZERO PROTECTING NATURE & BIODIVERSITY METRIC UNIT GRI 2021 2022 2023 2024 FOOTNOTE AIR EMISSIONS 1 Nitrogen oxides (NOx) kilotonnes 305-7 78.3 84.7 86.4 92.8 Sulfur oxides (SOx) kilotonnes 305-7 151.5 264.2 373.1 291.5 Non-methane volatile organic com- pounds (VOCs) kilotonnes 305-7 92.8 108.8 111.0 136.7 Carbon monoxide (CO) kilotonnes 305-7 32.4 34.9 37.0 39.0 Particulate matter (PM) kilotonnes 305-7 - - 1.9 2.1 145 ADNOC Sustainability Report 2024
 ADNOC Sustainability Report 2024: Driving Progress & Prosperity Page 144 Page 146