
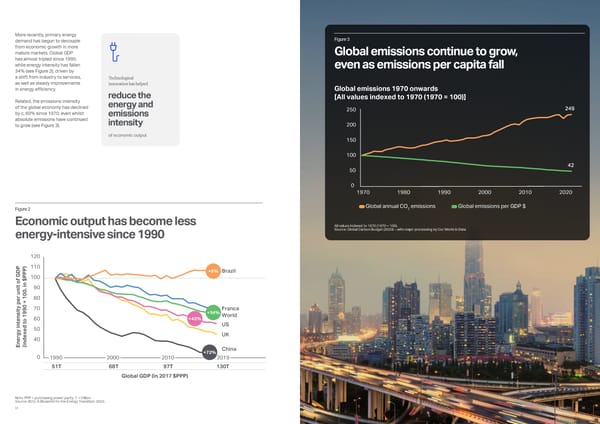
More recently, primary energy demand has begun to decouple from economic growth in more mature markets. Global GDP has almost tripled since 1990, while energy intensity has fallen 34% (see Figure 2), driven by a shift from industry to services, as well as steady improvements in energy efficiency. Related, the emissions intensity of the global economy has declined by c. 60% since 1970, even whilst absolute emissions have continued to grow (see Figure 3). 1990 2000 2010 2019 China Brazil France UK US World 40 60 80 100 120 50 70 90 110 0 Global GDP (in 2017 $PPP) Energy intensity per unit of GDP (indexed to 1990 = 100, in $PPP) 51T 68T 97T 130T +5% +34% +43% +72% Economic output has become less energy-intensive since 1990 Figure 2 Global emissions continue to grow, even as emissions per capita fall Figure 3 Note: PPP = purchasing power parity; T = trillion Source: BCG, A Blueprint for the Energy Transition, 2023. Global emissions 1970 onwards [All values indexed to 1970 (1970 = 100)] Global annual CO2 emissions Global emissions per GDP $ 42 249 0 250 50 150 200 100 1980 1990 1970 2010 2020 2000 All values indexed to 1970 (1970 = 100). Source: Global Carbon Budget (2023) – with major processing by Our World in Data reduce the energy and emissions intensity Technological innovation has helped of economic output 16 Powering Possible 15
 Powering Possible 2024: AI and Energy for a Sustainable Future Page 8 Page 10